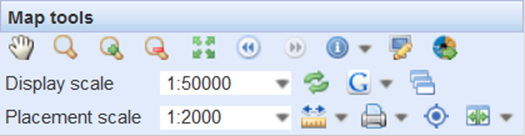
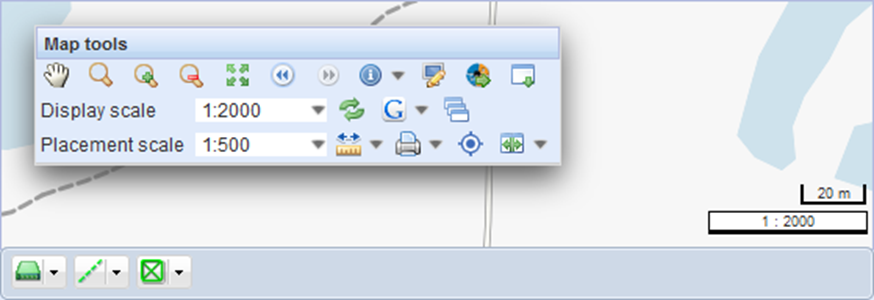
Panning the map
You can pan the map by clicking Pan in map tools. Hold down the left button of your mouse and move the mouse pointer across the map to pan the map. This enables you to move the map in the background, for example, when you are drawing a new duct.
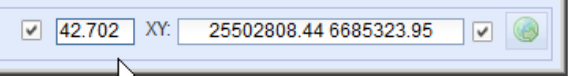
Coordinates
The coordinate section displayed in the bottom right corner shows the map coordinates for the location of the mouse pointer if Coordinate reading on/off to the right of the coordinates is selected. Coordinates are displayed in the XY field in the order east-north and are separated by a single space. The elevation value Z to the left of the coordinate field defines the object elevation when objects are created.

Centering map on given coordinates
- Enter (or paste from the clipboard) the coordinate values in the coordinate field. Note that the east and north coordinates are separated by a single space.
- Deselect the Coordinate reading on/off
 checkbox to prevent the coordinate values from being updated when you move your mouse pointer on the map.
 - Click Center map on the given coordinates
 .
.
Placing an object at the given coordinates
- Deselect the Coordinate reading on/offcheckbox.
- Enter (or paste from the clipboard) the coordinate values in the coordinate field.
- You can now place any point-type object at these coordinates in the following way:
- On the object form that is created, click Create
 or Modify
 .
. - Click Center map on given coordinates
 .
.
Picking the coordinates of an object
You can pick the exact coordinates of an object in the following way:
- Select Coordinate reading on/off.
- Position the mouse pointer over the object. The exact object coordinates are displayed in the coordinate field.
- Press the space bar on your keyboard to deselect Coordinate reading on/off .
- This prevents changes to the coordinate values, and you can copy the values to your clipboard.
Changing between coordinate systems
Have the coordinate section display the desired coordinate system by selecting the correct coordinate system from the drop-down menu. The selected coordinate system is used for all functions.
KeyCom uses a default coordinate system that is displayed in the Coordinate system drop-down menu in bold.
Coordinate elevation (Z coordinate)
The value in the coordinate elevation field to the left of the coordinate field defines the object elevation when objects are created. If the Active Z lock checkbox to the left of the elevation field is selected, the field value also defines the coordinate of the new point when snapping to objects. If you want to retain the existing elevation of an object when you edit its location, or if you want to use the elevation of the object you snap to when creating a new one, deselect the Active Z lock checkbox. The Export function also supports Z coordinates.
You can find further information on snapping to objects and following in the chapter Snapping and following (settings for drawing and modifying).
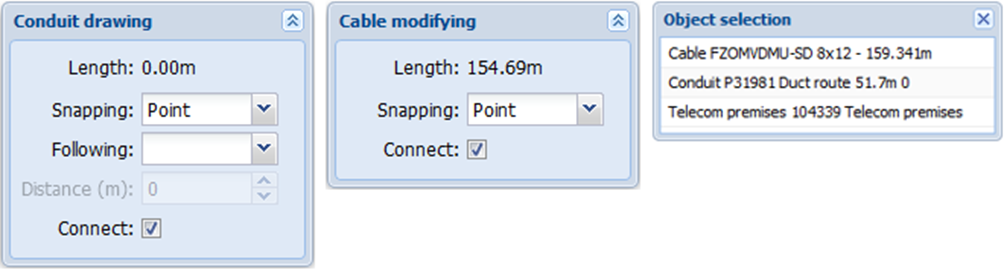
Snapping and following (settings for drawing and modifying)
When you create a new object or modify the geometry of an existing object, you can snap to or follow an existing object. When you do that, either the Drawing options or Modifying options form is displayed.
When you modify an existing geometry, or create a new one, and you press the SHIFT key on your keyboard, the mouse pointer will display the snap search radius . When you hold down the left mouse button while pressing the SHIFT key, the system will search for objects within the snapping radius. If multiple objects are found, a pop-up window for object selection is displayed. You can highlight an object on the map by selecting it from the list in the pop-up window. The object is highlighted on the map in a green colour (
 ). Snap to the object by double-clicking it on the list.
The Length value displays the length of the line object that is drawn or modified.
The Snapping selection list includes two options: Point and Nearest. If you select Point, you can only snap to the existing points of objects. If you select Nearest, you can snap to the nearest point on the next object.
When you digitize a new line object, you can follow the route of another line object if you select either Completely or Partially from the drop-down menu for Following. You can follow an object by double-clicking it in the Object selection pop-up window.
If you selected Completely, all vertices of the followed object are included in your new object. If you selected Partially, you can follow the object for as long as you want. Click on the map to define the point where you want to stop following.
Change the Distance (m) value to follow the route of a line object for the distance you choose. The default distance is 0 metres.
The Connect checkbox enables you to connect a line object while using snapping when starting and ending the drawing of it. When this checkbox is selected, the line object is connected to a point object.
Changing scale
You can zoom the map by clicking Zoom in . This zooms the map in while the map center remains the same. Zooming in is carried out one scale level at a time. You can also change the map scale using your mouse wheel. When you scroll the mouse wheel away from yourself, the map zooms in, and the map center is the mouse pointer’s position on the map.
You can zoom the map out by clicking Zoom out . This zooms the map out while the map center remains the same. Zooming out is carried out one scale level at a time. You can also zoom out by scrolling the mouse wheel towards you. The mouse pointer’s position on the map is used as the map center.
You can restore the map view to the default view by clicking Zoom to max extent  . Click Zoom to area
 to define the area that is used for zooming in. Use the left mouse button to define the area on the map. The map is zoomed in when you release the mouse button.
TIP: You can zoom the map in by holding down the SHIFT key and using the left mouse button to select the map area to zoom in. The map is zoomed in when you release the left mouse button. This is a fast way to zoom in to a larger scale.
Using the placement scale for new objects
If you know, when creating an object, that the printouts for the area will be created using a specific scale, you can use the placement scale when creating the object. For sparsely populated areas, for example, printouts may be created using a smaller scale than the one used for city areas, and, consequently, individual objects may not be clearly visible on the printouts. You can ensure the visibility of objects by using the correct placement scale.
In the Placement scale menu, select the scale that will be used for creating printouts. New objects will be created at a size proportional to this scale, and individual objects will thus be visible, for example, in a printout with a 1:2000 scale.
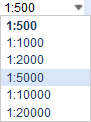
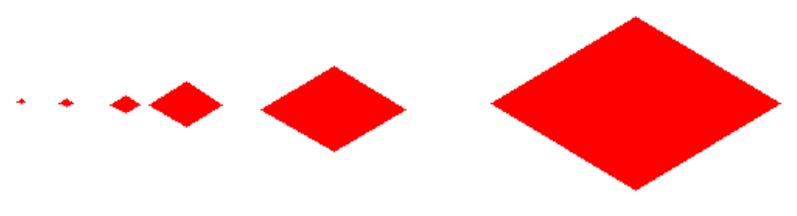
In figure below, a splice on a 1:2000 scale, drawn on a placement scale of 500, 1000, 2000, 5000, 10,000, and 20,000.
Measuring distance, area size, and perimeter
You can measure distances using the Distance tool. Click Distance and position the mouse pointer over the starting point on the map to start measuring. Click the left mouse button and move your pointer on the map. Enter points by clicking the left mouse button. Distance is displayed in the bottom left corner of the screen. The distance information is updated after adding each point. End the measuring by first clicking the left mouse button and then the right mouse button. Check the total distance.
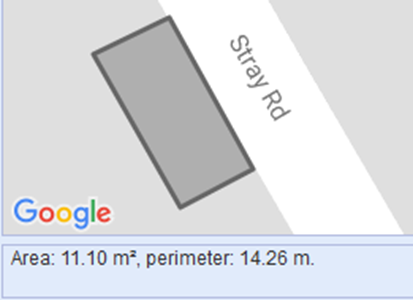
Measure the area size and perimeter by selecting Area size and perimeter on the Distance drop-down menu. Add points on the map to view the area and perimeter information for the polygon formed by the points and the mouse pointer. This area information is displayed in the bottom left corner of the screen. Stop drawing by clicking the right mouse button and check the complete area size and perimeter information. Click the left mouse button or Pan in Map tools to start a new measurement.
Info tool
You can use the Info tool to view information on map objects. Click Info and then use the left mouse button to click the selected object shown on the map. You can only select objects that are visible on the map; in other words, only the activated object layers are available. You can retrieve information on more than one object at the same time. There are several possible ways of retrieving information on multiple objects. You can define a rectangular area by selecting the area you want by holding down the left mouse button.
TIP: You can double-click an object on the map using the left mouse button to view the object’s information. The application then displays a separate object form on which the object’s information is displayed. If there are multiple objects in the area you double-clicked, they are listed, and you can choose the object you want to view.
From the drop-down menu next to the Info tool, you can select one of the following three functions: Map view area, Free area, or Existing area. When you select Map view area, the software retrieves information on all objects currently displayed on the screen. You can use the Free area function to define a free-form area on the map. You can use the Existing area function to select an area that has been saved in the system, such as a plan or service area, and to retrieve the objects in that area.
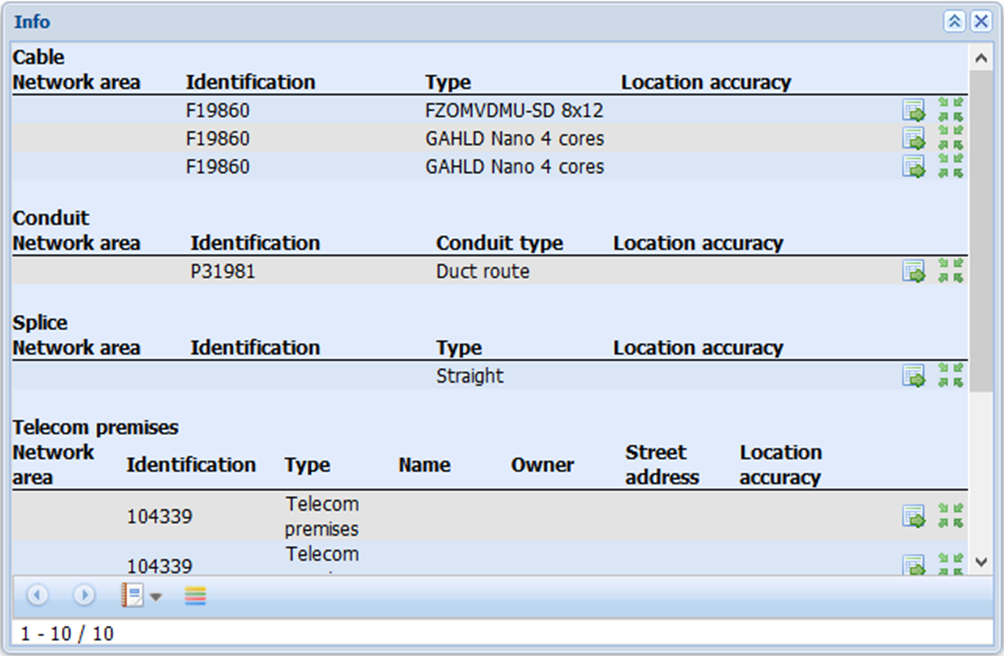
The query returns an Info list in which the search results are grouped according to their object type, such as telecom premises and conduits. The information displayed is basic information on the network objects, such as ID, type, owner, and usage state. The number of results is displayed at the bottom of the window. If the number of results is large, use the arrow buttons at the bottom of the window to browse through them.
Click  to center the map on an object of your choosing and to highlight it on the map. Click
 to modify the object’s information on an object form.
TIP: You can limit your search to specific objects by using object layer selection. For example, in the Layers tool, select only the Cables layer to limit your search to cables.
Exporting data and reports on map objects
- Select objects on the map as described above.
- Click Export
 to create a Bill of materials for the selected objects. You can also create external file formats using the export function.
Viewing the results of the Info query in a Group display
- Select objects on the map as described above.
- Click Show in group display
 to view the selected group of objects as a group of Info tool objects. The chapter Group display provides further information on the group display.
Map views
You can save the current map view by clicking Map views . You can create a new map view using the Map views form. You can edit, name, and save map views as necessary, and then return to the map view that you want to view by clicking Restore view
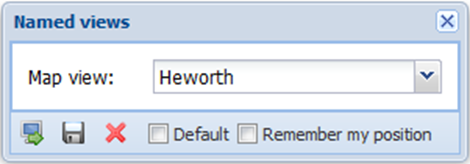
 . You can save several map views and select the map view you need from the drop-down menu. The view you select is then displayed. Select the Default checkbox to define a default map view. The map selected as the default map will be displayed as the initial view the next time you log into the system. When Remember my position is selected, the KeyCom application saves the map location, zoom level, and open map layers. The next time you log in, you can continue from where you were the previous time.
You can also click Previous view to return the previous view. This always takes you back to the previous view, one view at a time. Click Next view
 to go to the next view.
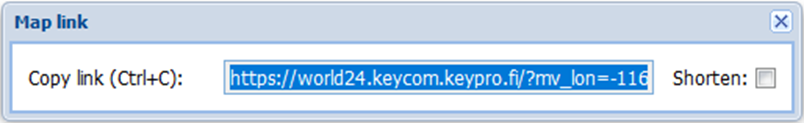
Map link
Copy the current map view and send the URL to, for example, your colleague or co-operation partner.
- Click Map link
 in Map tools.
 - Either select the long form or shorten it by selecting the Shorten checkbox.
- Copy the address.
- Paste it into an email or add it as a browser bookmark.
To return to the view later, copy the address into your browser’s address bar or use the bookmark you saved.
Dock/Undock all windows
Use the Dock/Undock all windows option, to dock all open forms to the bar displayed at the bottom of the map view. This tool enables you to clear the map view of all forms in order to get a comprehensive view of the network map. In addition, the toolbar includes user-specific favorites that are introduced in the chapter Favorite tools.
When you re-click Dock/Undock all windows , all docked windows will again be displayed.
Refreshing the map
You can view the changes made to a map by clicking Refresh map . This function is useful, for example, when the map data is being updated at the same time on another workstation, in which case changes are not necessarily immediately visible in the area that you are viewing.
Google Maps
View the current map view area on the Google Maps™ website:
- Click Google Maps
 to open a new browser tab to view the current KeyCom map view on the Google Maps website.
You can view a street view through the Google Maps Street View™ service:
- In the Google Maps
 drop-down menu, select Google Maps Street View.
 - Point to the road/street location that you want to view and click to open the view in question in Google Maps Street View.
These services are provided by Google.
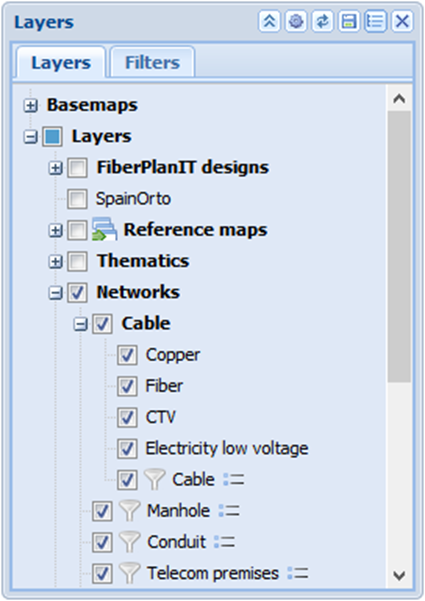
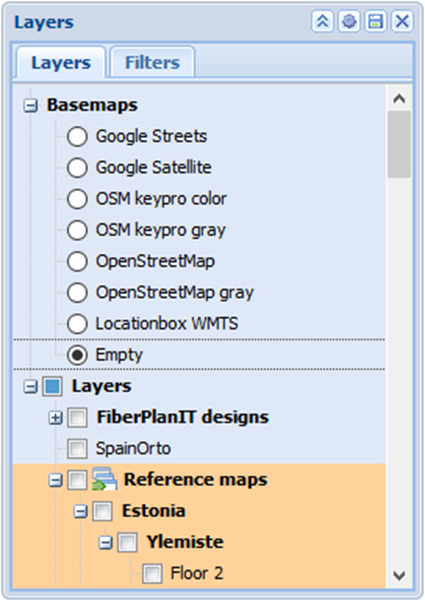
Layers (Layer selection)
You can select the background map and network object layers using the Layers tool. Click Layers
 to view the list of objects. The available map layers vary according to what has been agreed.
You can minimise or maximise the Layers tool by clicking the arrow at the top of the form. You can close the form by clicking the cross. You can hide the lists of background maps and lists of object layers by clicking in front of the row, and you can expand them by clicking
 .
.
Selecting the background map
The default map is one of the available maps. You can also select some other map as the default map, or you can select the option Empty, in which case no background map is displayed. Only one map at a time can be selected as the background map. The background map helps users understand where the network objects are located, and this map cannot be modified.
Object layers
The network object layers available for selection are listed under object layers. You can select multiple layers to be shown at the same time. If an object layer is not selected, its objects are not displayed on the map and you therefore cannot pick them from the map for forms. You should select, as a minimum, those layers that have objects you want to view or edit.
The network objects are layers that are available for selection. In addition, you can select addresses, surveyed objects, highlights, thematics, plans, photos, radio links, annotations, and free texts and lines. Some network objects cannot be selected if the scale is too small, that is, if the map is zoomed out too much. Examples of such objects are splices, telecom premises, manholes, and annotations.
The checkbox to the left of an object’s name indicates whether the object has been selected. You can remove or add an object by clicking its checkbox. You do not need to refresh the map afterwards as your selections will be applied automatically. If you want to activate all layers at once, select the checkbox for the highest layer (Layers).
TIP: The number of objects visible on the map is proportional to the speed with which the map is refreshed. For this reason, we recommend that you only select the layers you need to view on the map.
Sub-layers of the layer hierarchy (This function is subject to a separate order)
Sub-layers can be added to the layer hierarchy, for example, based on the cable technology. Sub-layers are available as a function that is ordered separately.
Layer legend and information
The Legend of a layer uses symbols and words to describe the type and status of the map objects. To view the Legend for a layer, click Show legend or use the right mouse button to select Show legend from the menu that is displayed. If a legend is not available, the button and the menu item are hidden.
The Legend list functions in a manner similar to stacks: when a new legend or thematic is selected in the layer selection, a new group is added on top of the list. You can expand or minimise groups by clicking and
and or by double-clicking the group header. You can hide a group by clicking
  .
.
A group is automatically hidden if its layer is not active in the layer selection.
Click Show details or select Show details in the context menu, which you can open by clicking the right mouse button. As is the case with legends, the button and menu item are hidden if no detailed information is available for the layer.
Thematics
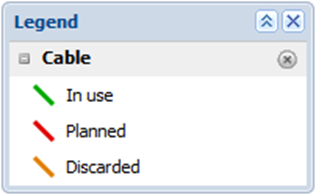
You can view objects on the map based on various object attributes. Thematics highlights objects based on, for example, network usage state or technology. You can view a theme legend by clicking Show legend in the context menu or by clicking Show legend  . The legend displayed shows the colors of the theme and related descriptions, such as information on the various network technologies. Color codes and shapes for legends can be configured through the admin user interface.
Conduit widths
This layer shows lines of various thicknesses drawn on top of conduits in accordance with the conduit widths.
Survey location accuracy
This layer shows lines drawn on top of line objects (cables, conduits). The width of the lines depends on the Location accuracy included in the survey file.
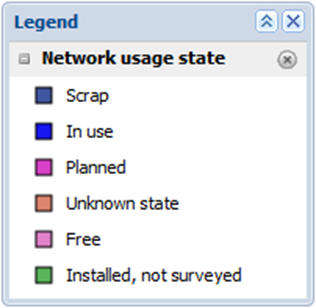
Network usage states
This layer shows KeyCom objects that are colour-coded based on the usage state of each object. You can view the colour codes in the Thematics legend. Click the Network usage state level with your right mouse button and select Show legend.
Network owners
This layer shows all KeyCom objects that can have Owner as an attribute. Point objects and conduits cannot have an owner, and so they are not shown in this layer.
Network position accuracy
This layer shows lines drawn on top of KeyCom conduits and cables. The width of the lines depends on the location accuracy information available on the Common settings tab of the object forms.
Network technology
This layer shows lines drawn on top of KeyCom cables. The line colour indicates the cable technology. For example, copper cables can be drawn in green while fiber-optic cables are marked in blue.
Cable role
This layer shows lines drawn on top of KeyCom cables, with the line colour indicating the role of the cable.
Installation type
This layer shows lines drawn on top of KeyCom cables. The line colour indicates the type of cable installation.
Cable connections
This layer shows lines drawn on top of KeyCom cables. The line colour indicates the physical state of the cable connection.
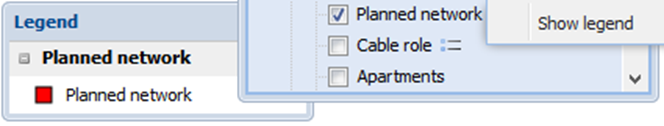
Planned network
This layer shows all KeyCom objects that have Planned network as their usage state. The colour coding for planned objects can be seen in the legend. Typically, red is used.
Configuring object layers
You can configure layers into separate groups. You can group similar layers into one group, for example, group all KeyCom objects into one layer, thus making it possible to view or hide them with a single click. Depending on your user rights, you can edit Layers by clicking Configure . You can configure layers when the background color of the form changes to orange.
Use your mouse to drag layers to a new location on the list. For example, you can move the Pole layer to the Telecom network group by grabbing the Pole layer with the left mouse button and dragging it to the top of the Telecom network group.
You can move layers that you do not use and hide them in the Ungrouped layers group. This Ungrouped layers group appears at the end of the list when the layer configuration function is activated.
Layer configurations
You can save a Layer configuration, i.e. the selected background map and the active layers, by clicking Save in the top-right corner of the Layers tool. Layer configurations are saved in the browser cache of the browser that was used and are therefore not available on other computers.
Layer configurations can also be saved in a database with a username, in which case the layer configuration is user-specific instead of browser-specific. Save a layer configuration in a database by clicking Configure , and wait for the background colour to change to orange. Click Save
  to save the layer configuration in a database.
Upload the saved layer configuration to the Layers form by clicking Reload . You can restore the original layer configuration settings by clicking Reset to defaults
 .
.
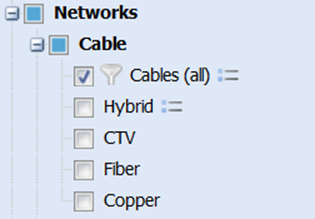
Layer filters
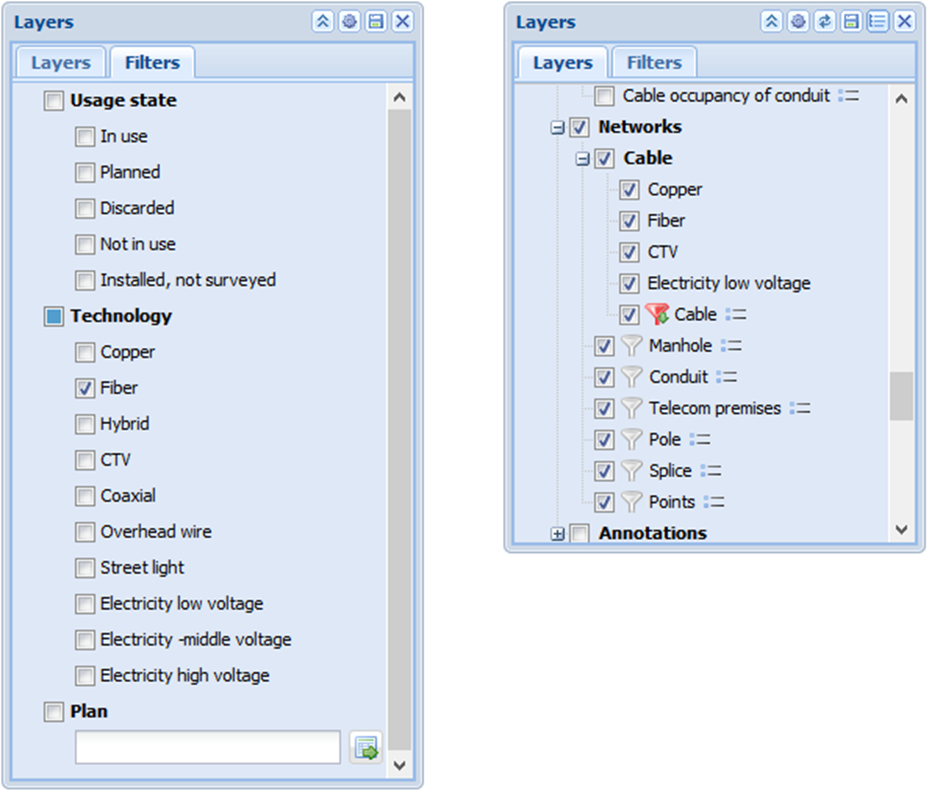
Layer filters are used for limiting the number of objects shown on the map. Objects can be filtered based on technology, usage state, and plan. When filters are used, only the objects selected on the filter form are visible on the map.
Active filters are marked in the layer selection list: A filtered layer is marked with a highlighted filter symbol . When a filter is not selected, the icon is not highlighted
 .
.
For example in the figure, filters for fiber-optic cables are active (left). The icon preceding the filtered layer is highlighted in red (right).
Printing
Use the Print tool for print series and quick print. Print series refers to printouts that consist of one or several parts, whereas quick print enables you to quickly create a printout of the map.
Quick print
In the Map tools bar, click Quick print to access the Quick print function. In print settings, you can define settings related to paper size and the display settings for the detailed information to be included in the printout.
Start quick print by filling in the form. The form fields Paper size and DPI must be completed in accordance with the paper and printer you are going to use. Paper size means the physical size of the printing paper. In the Scale 1: field, Enter the size of the print area as a scale proportion. When the display scale is 1:500, and the same scale is applied to the printout, the printout proportions are the same as in the map view. In addition, you can include a print legend (Legend) and a Theme legend on the printout. You can also define their location on the printout.
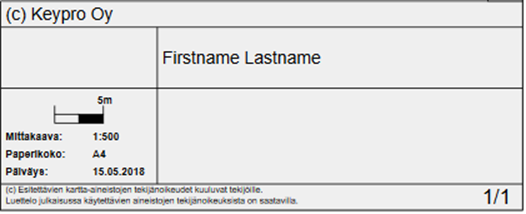
The Print legend refers to the map legend, which includes information on the paper type, scale, person creating the printout, and date of printing. You can add your own text in the Note field.
You can include a Theme legend on the printout by going to the Layers list and activating those theme levels that you want to include. In the drop-down menu for the theme legend, select the location of the legend. The Theme legend on the printout will include the same information as the Themes – Show legend window.
The borders of the print area (the frame limits) move with the mouse pointer. When you click Quick print, the Frame digitizing options and Frame options selections are displayed. In Frame digitizing options, you can select the snapping point of the movable printing frame by moving it while holding down the SHIFT key. Select Point for snapping if you want to move the point to the same location as an existing point. Select Nearest for snapping if you want to position the point on top of a line object. This moves the point to the nearest snapping point on the closest line object.
In the Frame options window, you can modify the orientation and rotation of the print area on the page. The changes you make are applied immediately to the frame shown on the map.
Use the left mouse button to select the desired location of the frame and print it using the right mouse button or click Print on the form to have the browser provide the file in PDF format for downloading.
To relocate the frame, use your left mouse button to point at the red square in the middle of the frame and, while holding the button down, drag the frame to the location you want. Click Print to print.
Print series
The difference between print series and quick print is that a print series consists of several map printouts (frames). The first page of a print series includes an index map showing all the map printouts, and it provides an overview of the individual frames with their numbers and locations. This feature helps to locate the various series printouts on the map. Activate the Print series function in the Print drop-down menu . The number 0 in the No. field refers to an index map, while the other rows are the created printouts.
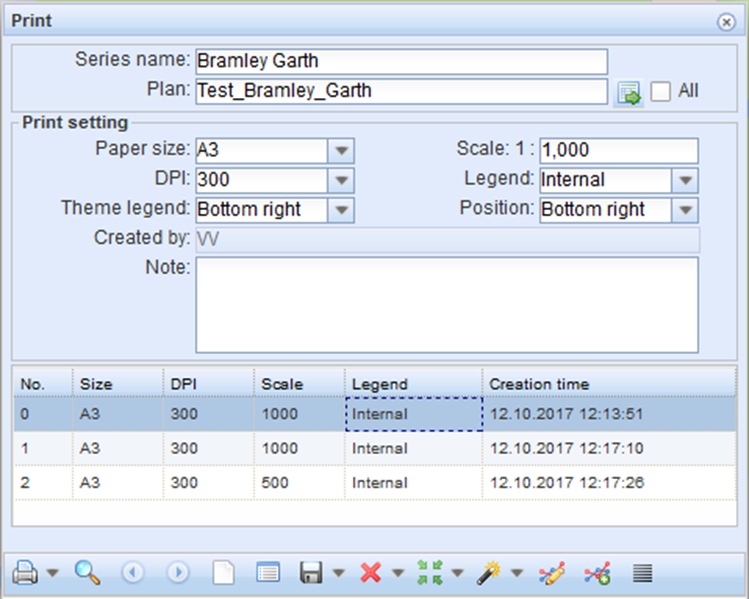
The Print series form includes fields for settings and a field for the printouts (frames). The first row of the list of frames is always the title page, and the actual frames are listed below it. The settings information displayed in the form’s fields is related to the frame that is active in the list of frames. You can edit and save printout-specific information. You can also create printouts of single frames.
Fill in the form fields as described for quick print. After this, click Save form to activate the creation of frames. Click Create
 to start creating map frames. The borders of the print area (frame) move along with the mouse until you select the map location you want by clicking the left mouse button. When you create a print series, the Frame options and Frame digitizing options are also displayed. Please see the chapter Quick print for more details on these.
Click the right mouse button to accept a frame. A new printout line is added to the list of frames on the form. The number of frames is not limited. You can also edit the settings for each frame, for example, modify the scale of the printout.
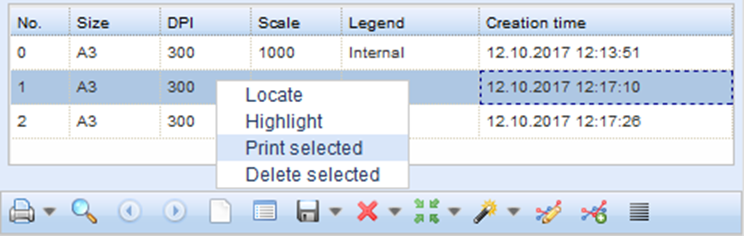
You can download the Print series in PDF format by clicking the Print button on the form. The browser will provide a PDF file for download, and this file includes the entire print series. Print a single frame by selecting Print selected in the drop-down menu for the Print button. The frame selected in the list of frames is printed. Alternatively, you can print a frame by clicking a frame on the Print form using the right mouse button and selecting Print selected. The menu also includes options for locating, highlighting, and deleting a frame.
You can also use the Quick print function on the Print series form. The drop-down menu for the Print button includes the option Quick print.
Locating yourself
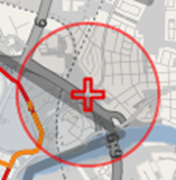
The Locate  tool enables you to center the map based on the location of your equipment. Depending on the functions of your equipment, your location can be based on, for example, GPS coordinates or the location information obtained from a wireless or fixed network. A cross symbolising the location and a circle representing the margin of error are shown on the map. Please note that the network location information may be extremely inaccurate.
Splitting your display
With the Split map tool, you can split your display into two or three sections to view the map in one section and the forms in others, so that they are not on top of the map. Use the tool options to select whether you want to have the new display section on the left or right side of the map view, or on both sides. You can deactivate the Split map function using the Cancel command in the tool.
TIP: This is a very useful tool if you are using more than one monitor. For example, you can view the forms on one monitor and the map on another.