Adding an area
To add an area with the required shape on the map, go to the main tool bar at the top and click Area  . You can add an area on the map, for example, for a print-out. You can define the name, type, colour, and usage state of an area, and you can attach it to a plan. To start the creation of an area, click Create
 . Move your mouse pointer across the map and click the left mouse button to enter points at appropriate locations. Enter the final point by first clicking the left mouse button and then the right mouse button. The area is automatically saved in the database.
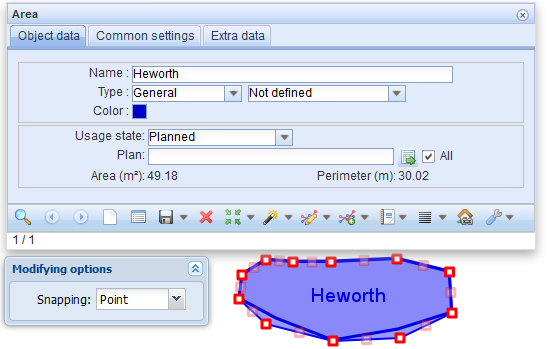
The area in the illustration has been selected for modification. The points of the area have been highlighted.
Adding a point buffer
- In the drop-down menu for Create
 , select Create point buffer.
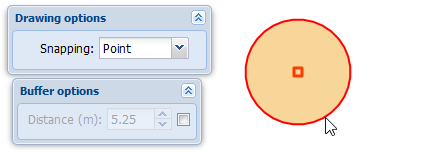
 - Position the center of the point buffer on the map. You can use the Snapping options Point and Nearest. Hold down the SHIFT key and click the left mouse button to snap.
- Move the mouse pointer to define the distance.
- Finalise by clicking the left mouse button. The area is now saved.
Adding a line buffer
- In the drop-down menu for Create
 , select Create line buffer.
 - Define the distance in metres, or deselect the checkbox next to the Distance field.
- Select the End cap style for the line’s end points: round, flat, or square.
- Draw the line on the map.
- If you cleared the checkbox for distance, define the distance by moving the mouse.

Addresses and apartments in an area
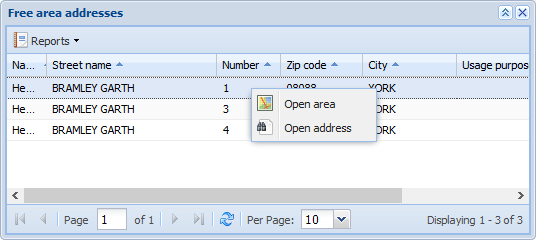
To list the addresses located in the area, go to the drop-down menu for List  , and select Free area addresses or Free area apartments. The form type displayed is similar to the form in the List chapter. The Free area apartments form provides information on the number of apartments at the addresses. To create a list report on the apartments or addresses in the area, select
  Reports – List report. Right-click to edit an area, address, or apartment on the appropriate form.
Adding a line
You can freely add lines of various size and colour on the map, for example, for a print-out. To do this, click Line  . The buttons on the Line form
  function like the buttons on other forms, as described in the chapter Buttons on object forms. For example, you can search existing lines on the map by clearing the form and clicking Search
  . You can also locate and highlight lines. You can modify the colour or thickness of the lines you searched and picked from the map. Click Save form
  to apply the changes to the map. The Lines layer is activated in the Layers selection when the Create
  and Pick
  tools are used.
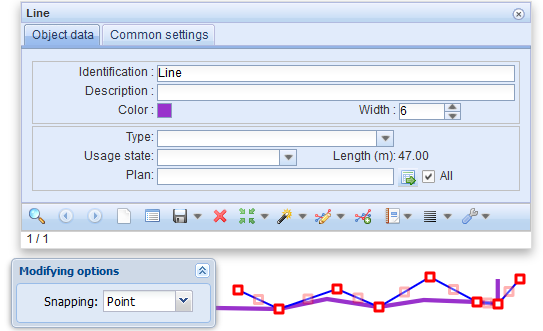
The line in the illustration has been selected so that it can be modified. The points of the line are highlighted.
If you want to create a new line, first select the colour and thickness. To start the creation of a line, click Create  . Then move your mouse pointer across the map and click the left mouse button at the appropriate location to create the starting point of the line. To create the end point, first click the left mouse button and then the right one. The line is automatically saved in the database. When you click the Create button, the Drawing options dialogue box is displayed. The functions of this dialogue box have been described in the chapter Creating a new object.
You can define the usage state of a line, and you can attach it to a Plan. Click Save form  to save changes.
You can reposition the line by clicking Modify  . The line in question is then highlighted on the map. When you click the line using the left mouse button, the line can be modified. You can move the line’s points by dragging them while holding down the left mouse button. Create more points by dragging the dimmed squares that are located between the actual line points. When you move these squares, you create more points. When you modify a line, you can also use the Snapping functions Point and Nearest. Click Save form
  to save changes.
Adding text
To add text on the map, such as comments or observations, use the Text tool in the toolbar at the top of the screen. Apart from the Create and Modify functions, the Text
  form functions as described in the chapter Buttons on object forms.
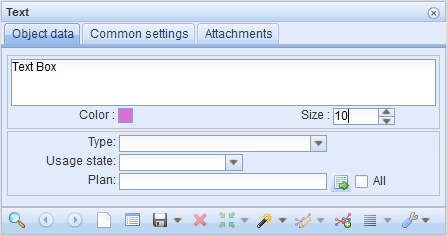
- Open the Text form by clicking Text
 in the main toolbar.
 - In the text field, enter the text you want to add.
- Select the Colour, (font) Size, and other information. Note that the placement scale does not affect the size of the text – only the font size does.
- Click Create
 in the form’s toolbar.
 - In the Freetext digitizing dialogue box that is displayed, select Type.
Text: Only text on the map.
Frame: Text with frames.
Select the Border colour.
Select the Fill colour.
Adjust opacity using the Fill opacity selector.
- Line: underlined text.
- Select the Border colour (colour used for underlining).
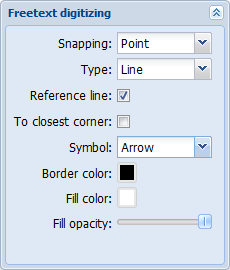
Position the text at the appropriate location on the map.
Use the  tool to rotate to the appropriate angle.
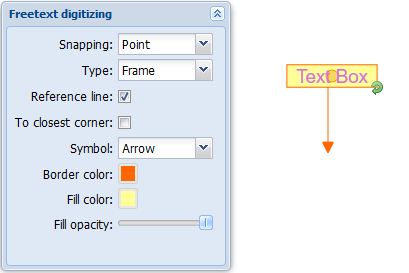
TIP: You can edit the text, colour, and size at any time when creating text.
Complete the process by right-clicking, or click Save form  on the form.
Note! The drawing options you selected are session-specific. With this, adding texts using the same style will be quicker.
Adding text with a reference line on the map
Steps 1–5 as described above, but select Frame or Line as the type.
- Select the Reference line checkbox.
- Select the To closest corner checkbox if you want to connect the reference line to the nearest corner instead of the nearest point.
- Select Symbol
- None: the line has no symbol.
- Arrow: The line is an arrow pointing to a point.
Circle: see the chapter Adding text with a circle reference line on the map.
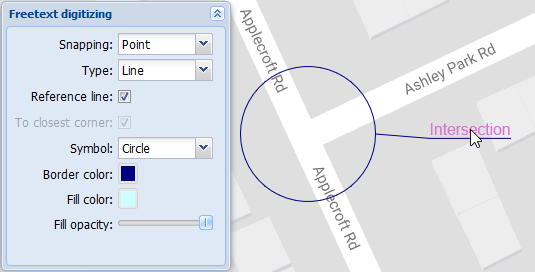
Position the starting point of the reference line on the map and move the mouse to see the line attached to the text.
- Position the text at the appropriate location.
- Rotate using the
 function.
 - Complete the process by right-clicking, or click Save form
 on the form.
Access area (This function is subject to a separate order)
Use the Access area  tool to limit the network in which objects are displayed to various users or user groups. The right to use network objects can be defined, for example, based on area, the owner, or the creator of the object. You can also restrict the right of use to specific network objects, such as telecom premises or cables. The settings are discussed in more detail in the Admin user guide.
Click Access area  to create a new permitted area on the map. Continue as instructed in the Adding an area chapter.

Use the List  function to create a list report on permitted areas and to modify the access areas and the related addresses and apartments in the list view. Access areas can also be exported to a group display.
External documents
External documents  can be files or URL links that can be positioned on the map and attached to network objects. To open the form, click External documents
  in the toolbar or on the Attachments tab on the forms. For more information, see the chapter Attached documents.
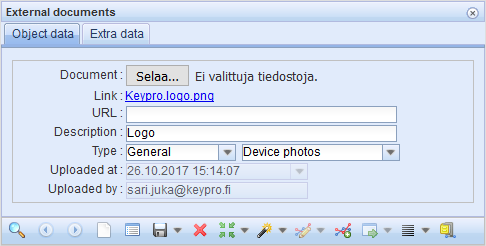
Viewing external documents
To open a document, click the link below the Choose files button. If the attachment is a URL link, it is opened on a new tab in your browser. The function for opening a file depends on your browser and browser settings. Usually, the browser asks whether you want to save or open the file.
TIP: If an external document includes both a file and a URL link, you can open the URL link by copying it to the address field in a new browser window.
Adding external documents
- If you want to add a file, click Choose files.
- Select the file or files that you want to attach as external documents.
- Save the information on the form (Type is a mandatory field).
- Click Save
 , or if you are attaching documents to an object, click Attach document
If you selected several files, a separate external document is created for each file.
TIP: If you want to attach a web address, enter it in the URL text field or copy the address from the browser. If you also select a file, the URL is additional information to the document.
Deleting an external document
- Retrieve to the form the document you want to delete.
- Click
 Delete. If the document has been attached to an object, you will be asked to confirm the deletion.
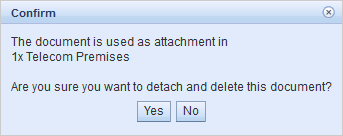
Restrictions for deleting an external document
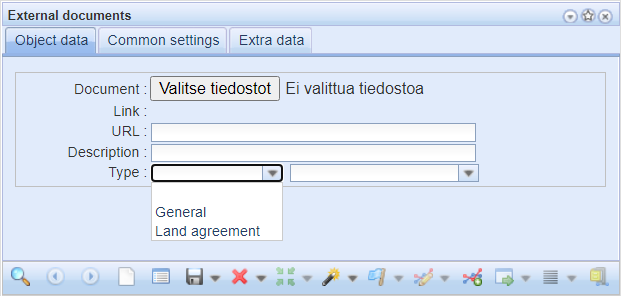
If you want to make sure that the external documents you added are not deleted by accident, you can restrict their usage rights. Click External documents -form from the toolbar and then select for example, Land agreement as the new type for the document. These types of documents cannot be deleted from the External documents
 -form. The term Land agreement can be changed from the admin user interface.
Line of sight tool (This function is subject to a separate order)
The Line of sight  tool needs to be purchased separately. This function makes it possible to create a height profile on the form based on the contour lines in the database of the National Land Survey of Finland. The line of sight tool
  illustrates the radio link between masts and the ellipse illustrating the related first Fresnel zone for the selected frequency. This function includes the height profile of masts and the profile of trees at the given height above ground level. In addition, the curvature of the Earth is taken into account.
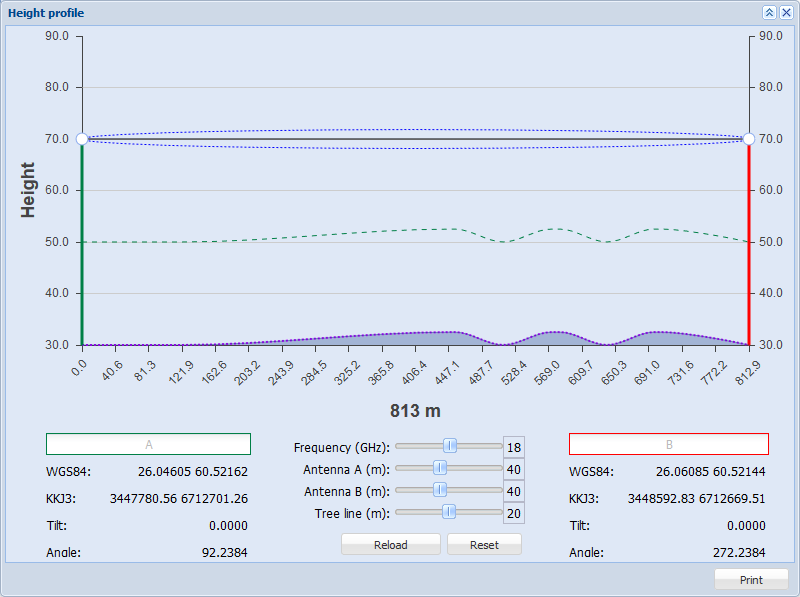
Creating a line of sight profile
Open the form by clicking Line of sight  in the toolbar at the top. The program then asks you to enter the start and end points of the profile. First, click to enter the location of the antenna A on the map and then enter the location of the antenna B. After you have entered the location information, the height profile is displayed.
Use the sliding controls on the form to modify the look of the automatically created height profile. Frequency controls the frequency applied to the profile. Antenna A, Antenna B, and Tree line are used to define the distance between these objects and the ground level in metres.
When you edit the original values of these sliding controls, click Reload to update the profile on the form. Click Reset if you want to restore the sliding controls to the original settings.
Click Print to create a printable version of the height profile.
Group display
The Group display  function helps you view various object groups. You can use it to edit and highlight a group or its objects, or to combine a group with another group. In addition, you can open objects in a group on their own object forms and on object form lists.
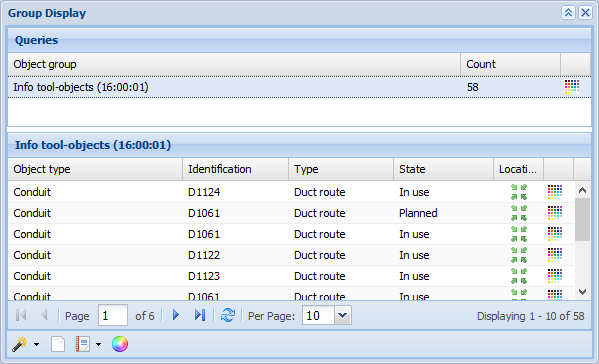
Groups are groups of searched objects or combinations of them.
Creating groups
Groups can be created in many ways:
- Add object form search results as a group to a list using the Show in group display function in the drop-down menu for List. More information on this function is provided in the chapter Show in group display.
- Pick objects from the map through the Group display form, as described in the chapter Picking objects from the map.
- View the results of the Info query in a Group display.
- Retrieve the objects of a Plan. This is discussed in more detail later in this document in the chapter of Show in a group display.
Renaming an object group
- Right-click the (context) menu for the Group display.
- To rename an object group, either double-click a group or select
 Rename in the context menu, in which case you do not need to select the row.
 - Enter the new name in the Object group field.
- Complete editing by clicking outside the field.
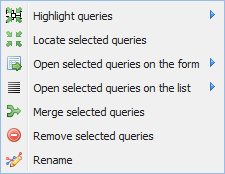
Merging object groups
- Select the groups you want to merge on the list.
- In the context menu, select
 Merge selected queries.
 - Enter the new name in the Object group field.
- Complete editing by clicking outside the field.
Highlighting groups
- Select the colours used for highlighting the groups.
- In the context menu, select
 Highlight queries to highlight the selected groups and groups for which you assigned a colour. Groups with no colour assigned are highlighted using the default colour. To apply a specific highlight colour for the selected groups, select the colour in the sub-menu. The items outside the selection are then highlighted using the default colour.
Locating queries
- Select the group(s) you want to locate.
- In the context menu, select
 Locate selected queries.
Opening groups on forms and lists
- Select the group or groups you want to open.
- a) Open all search results by selecting Open selected queries on the form or Open selected queries on the list. Or:
b) In the sub-menu, open a single group of search results.
Removing groups
- Select the group you want to remove.
- In the context menu, select
 Remove selected queries.
Opening a group’s objects on forms and lists
- Right-click the (context) menu for the Group display.
- Select the objects.
- In the context menu, select
 Edit selected.
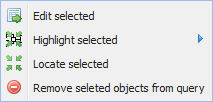
The selected objects are opened on their own object forms.
Highlighting individual objects in a group display
Highlighting options: Select the highlight colour separately for each row, select the same colour for all, or use the default highlight colour.
- Select the objects you want to highlight.
- a) In the context menu, select Highlight selected to highlight the objects using the default colour, unless you have defined a colour for the row in question.
b) Highlight all selected objects using the same colour by selecting the colour in the sub-menu.

Note! The next time highlighting is applied, the current highlighting is removed. For this reason, if you want to highlight additional objects, you must include the currently highlighted objects in the selection.
Clearing the highlighting of group objects
To clear the highlighting of objects, select Clear in the context menu for Highlight selected.
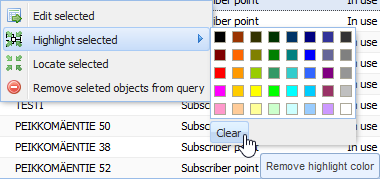
The highlighting of objects is cleared when you switch to another group or delete objects.
Locating individual objects in a group display
In the Location column, click Locate  to center the map on the object and highlight the object. If there is no Locate
  button visible on the object’s row, the object in question has no location defined. Locating multiple objects: First, select the objects you want to locate. Then, in the context menu, select Locate selected queries.
Removing an object from a group
- Select the objects you want to remove.
- In the context menu, select
 Remove selected objects from query.
Group reports and exporting a group to an external file format
To create an Excel report on the group opened on the object list, click Reports. In the drop-down menu, select Reports  Current query to Excel. A new browser window is opened. The Excel file is handled in accordance with the device and browser settings. Follow the instructions displayed.
In the drop-down menu for Reports, select Export Export current query to... to export the current group to an external file format. This opens the Export settings dialogue box. See the instructions in the chapter Exporting objects to external file formats (This function is subject to a separate order).
Creating user themes
- Create object groups in the Group display
 . For more information, see the chapter Creating groups.
 - Select the highlight colour for each group.
- Click Save as new theme
 .
. - In the dialogue box that is displayed, enter a name for the theme and click OK.
More information on user themes is provided in the chapter User themes.
User themes
Open the User themes form by clicking  in the toolbar at the top. First, plan the highlighting applied to the group display and save it as a User theme
  for later use.
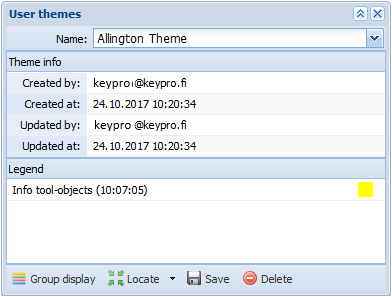
Viewing user themes
- Open the User themes form by clicking User themes
 in the toolbar.
 - In the Name field, select the theme you want to view.
- Click
 Locate and
  Highlight to view the selected theme. The map is then centered on the theme and objects are highlighted using the selected colours.
 - To view the content of the theme, click Group display
 and select in the Group display the group you want to view. The functions of the Group display are described in the chapter Group display.
Editing user themes
- In the Name field, select the theme you want to edit.
- To change the highlight colour, click the Highlight colour icon and select the colour you want to use.
- Click Save
 to save changes.
TIP: Edit the contents of the theme by updating groups in the Group display and by saving/replacing a User theme using the same name.
Deleting user themes
- On the User themes form, on the list in the Name field, select the theme you want to delete.
- Click
 Delete. You will be asked to confirm the deletion of the theme. Click Yes to delete the theme.
User filters
The User filters feature allows you to leave specific KeyCom tools visible on the map. The feature supports Telecom premises  , Pole
  , Conduit,
  , Splice
  , Manhole
  , Cable
 , Point object
  , Exchange/telecom are
  and Contract
  forms.
For example, if you want to see just Telecom premises, you must add them to your User filters.
- First, open a
 Telecom premise form via the KeyCom tools. If you open an empty form, start creating your filter by adding the information.
 - You must at least add the type and usage stage.
- Then click
 Create and add it to the map. You can also use the Search
 feature to search for Telecom premises which already exist on the map. It uses the information you added on the form. You can repeat this process for any KeyCom tools available.
 - After saving your work, you can add the KeyCom tools to your User filters. Use the
 Add to user filter feature on the toolbar.
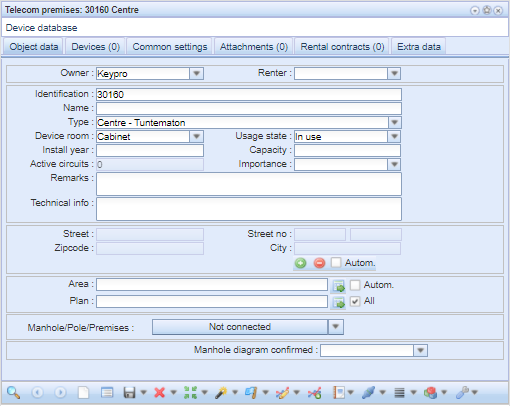
Activate the User filters by clicking the Show only user filtered  button on the main toolbar. The logo will change its color from blue to green when it is in use. You can add other tools to User filters at any time by opening their form and repeating the process. They will appear automatically when the Show only user filters
  are on.

If you want to examine your User filters, you can open them on the Group display list  by clicking the drop-down menu. You can also delete all filters via the same menu by clicking Clear user filters.

All your User filters can be found on the Group display list  . You can easily view, edit, and delete objects in the same place. All User filter objects are listed below the Object group section, and you can click one of them to open the context menu.
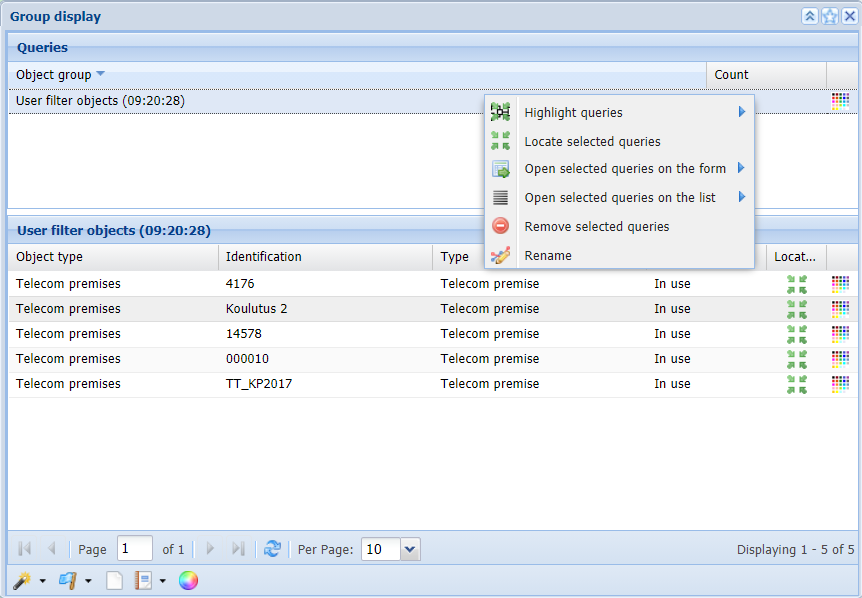
Functions of the context menu
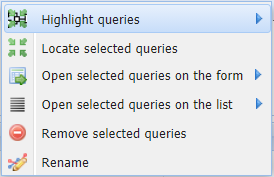
 Highlight queries: This function allows you to change the color of the Object group seen on the map.
 Locate selected queries: This function locates all objects in an Object group on the map.
 Open selected queries on the form: This function opens the Object group on the form.
 Open selected queries on the list: This function opens the Object group on the list.
 Remove selected queries: This function removes the selected Object group from User filters.
 Rename: This function renames the Object group.
Note! You can change the name to something that describes the object group as accurately as possible.
Access list
The Access list  function keeps a record of forms that were opened during a session and the objects retrieved to the forms. This makes it easier to return to the objects. Select a row on the list and click Open
  to open the object form.
On the Access list, you can view the type and identification of objects and the time when a specific object was handled.
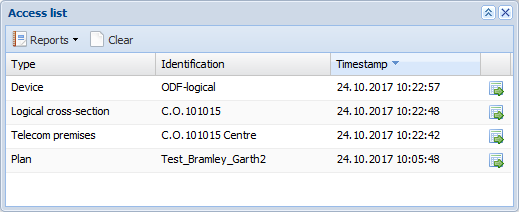
TIP: If you have deleted an object, you cannot retrieve it to an object form by clicking the Open button. Instead, use the Global change history function.
You can create an Excel report on the access list information by selecting History report in the drop-down menu for  Reports. Click
  Clear to clear the access list. The Access list is automatically cleared when you log out from KeyCom.
Global change history
To view the global change history, click Global change history  . The Global change history function lists all saved changes starting from the most recent one. Click a column header to sort the list or select the sorting order in the menu for a column. View the current version of an object by clicking
  Open form in the context menu.
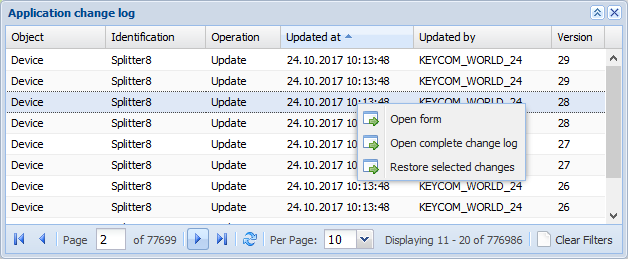
Viewing changes made to an object
In the context menu, click  Open complete change log to view the full change history of an object. The Change history form is displayed with the row in question pre-selected. More information on the form that is displayed is available in the chapter Change history.
Restoring changes
To restore changes, take the following steps:
- On the list, select the changes you want to restore.
- In the context menu, select Restore selected changes.
- In the Report on restored changes that is displayed and that includes separate fields for Restored and Failed, check that the change was restored successfully.
Note! If you selected more than one version of the same object, only the most recent version is restored.
Using filters
You can filter the changes displayed on the Global change history list by activating the required filters in the drop-down menu for a column header. When filters are activated, the related column headers are marked in bold and italics.
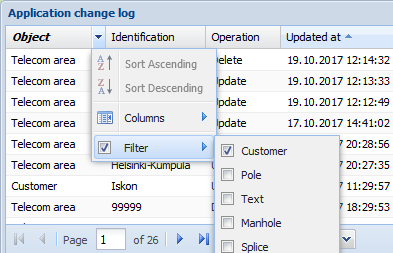
Clear a filter by deselecting it in the drop-down menu for a column header, or click  Clear filters in the bottom right corner of the form. This clears all filters.
Tasks
Tasks are, for example, work related to various construction phases or maintenance. You can define tasks for individual objects or a plan. Most of the Task
  form functions are the same as on other forms. More information is provided in the chapter Buttons on object forms.
TIP: You can define tasks, for example, in order to document in detail the work phases required for network building and to link them to the correct objects and plans.
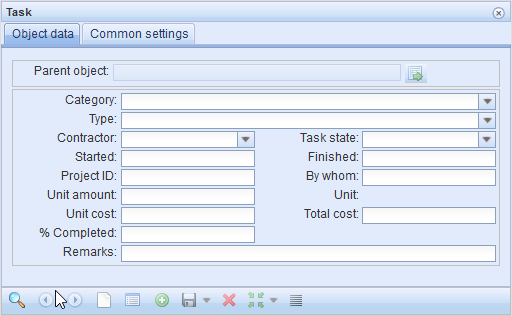
Creating a task
- Open the required object on the object form, or click Show the parent object
 to open the parent object.
 - Follow the instructions provided in the chapter Adding a task for an object.
Locating and highlighting the parent object of a task
Click Locate parent object  to highlight and locate the task’s parent object. This button functions in the same way as on any other form, but the location here is the location of the parent object. More information on locating is provided in the chapter Locating and highlighting an object.
Managing defaults
Default values can be defined for most objects, and users can use these values as the basis when they create a new object. For more information, see the chapter: Default form values.
Managing settings defined by an admin user
Admin users can save default values for an object by clicking Save as default in the menu for Save  . The defaults are then available to all users. The Save as default function is only displayed for admin users, and it is active when a form has been cleared or an unsaved object is open on the form.
Managing settings defined by a user
On the Plan and Exchange/Telecom area forms, you can define the object in question as the default for the duration of the session. Click  to do this. After this, in addition to other default settings, the Plan and Area fields are filled in on various forms when you click Defaults
  . For further information, see the chapter Set as the default plan.
The defined defaults are displayed in the  Defaults dialogue box in the top-right corner of the screen.

Click Show on the form  to open the default object on its own form. Click
  to remove the default setting.
TIP: If there is no Defaults  button in the top-right corner, the user has no active default settings.