The Height profile diagram tool provides lateral information on the duct’s elevation relative to the ground. It includes both a graph and a data table to help analyze the structure and components of the linear object.
You can activate this tool from the Tools menu within the KeyAqua Nexus tools.
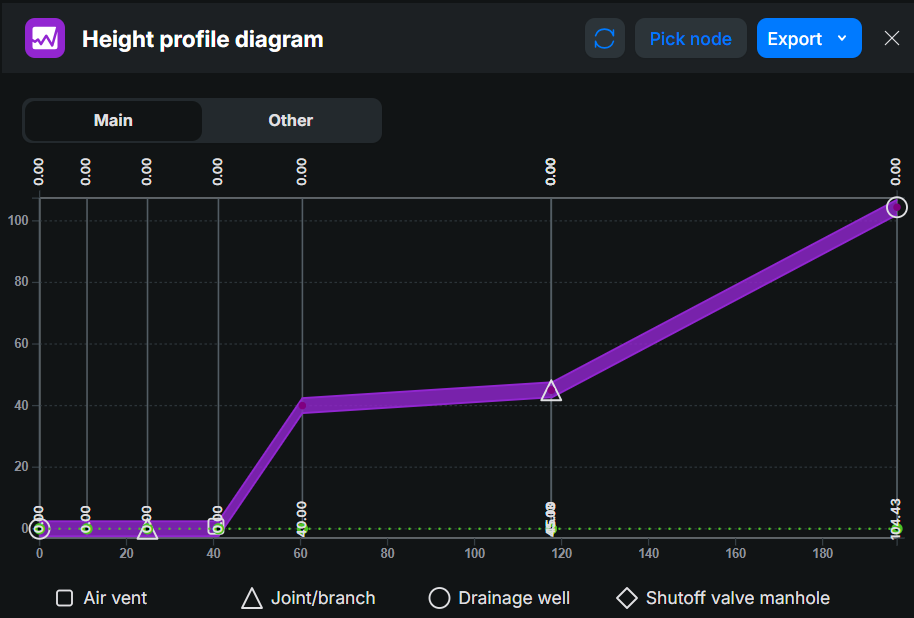
Height profile graph overview
The x-axis shows the distance along the duct (0–180 units). The y-axis shows elevation (0–100 units). The purple line represents the duct’s elevation profile. Symbols on the graph indicate specific components:
- ● Circle – Air vent
- ▲ Triangle – Joint/branch
- ■ Square – Drainage well
- ◆ Diamond – Shutoff valve manhole
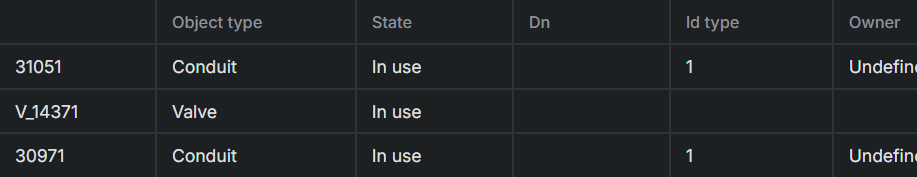
Height profile table overview
Below the graph, a table lists details of the network objects:
- Object type (e.g., Conduit, Valve)
- State (e.g., In use)
- Dn (Declination)
- Id type (e.g., Undefined)
- Owner (if specified)
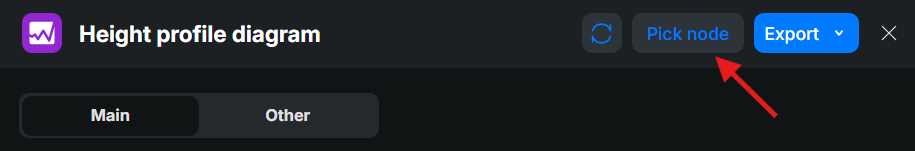
Picking a height profile
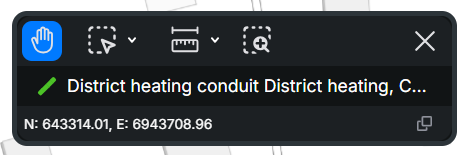
- Open Height profile diagram and activate the Pick node tool.
- Define an area on the map where the desired linear object (e.g., a duct, a conduit) is located.
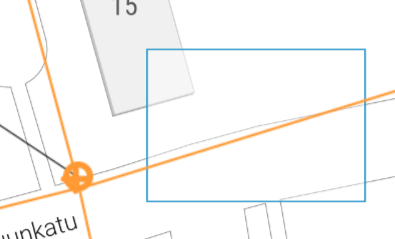
- From the list of identified objects, double-click the ID of the correct one to select it.
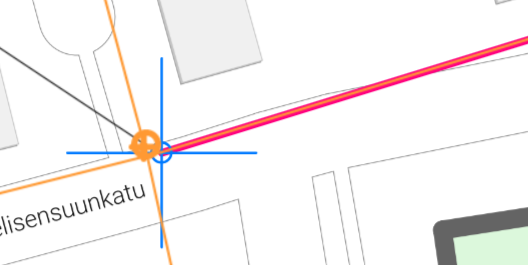
- If you want to continue the selection to another conduit across point objects (e.g., a manhole, a valve, a node), define the direction by clicking the correct end of the conduit.Note!Even if you only want to generate a height profile for a single linear object, you must still define the direction. To do this, simply select the same linear object a second time by clicking on its opposite end.
- Define another area on the map to select another conduit
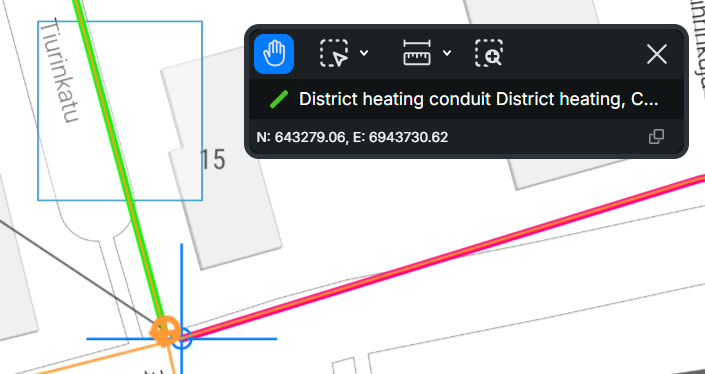
- The selected linear objects will then be displayed in the form.
Click Reset to clear and reset the Height profile form. To download the Height Profile Diagram as a PDF file, click Export in the top-right corner of the form and select PDF from the drop-down menu.