Diagram form can be found from the Tools in the main toolbar by opening the sub menu. Use the Diagramform to create diagrams of the links between various objects.
You can create, search, and delete diagrams, and add or delete diagrams on the map. On the form, you can create network diagrams of a specific area and a connection diagram for one or multiple objects selected on the map. Click Print diagram or Print part of diagram to print the diagram or a part of it. You can highlight threads using the Pick diagram objects button. To highlight a circuit, click a circuit point or a cable thread/fiber with the left mouse button. This function makes it easier to follow a route in the diagram.
In the figure below, a connection diagram and a highlighted object in the diagram.
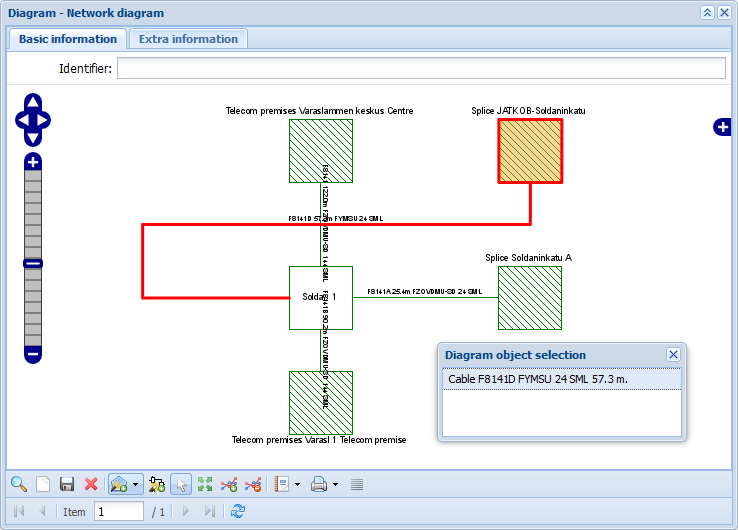
Network diagram: Illustrates the physical connections between telecom premises, splices, manholes and cables.
Connection diagram: Describes the thread connections of some specific telecom premises, splice, or manhole.
Tree diagram: Illustrates the connections of a device or cable either completely or partially for a selected connector/pair range.
Creating a diagram
To start creating a new diagram, click Clear on the form. Next, click Create a network diagram from selected area
 and select the area on the map (alternatively, you can create a diagram from a map view area, free area, or an existing area), or click Create diagram based on object
 . Then select the telecom premises, splice, or manhole on the map. A diagram of the selected object/objects is displayed on the form. Finally, enter an identifier for the diagram and click Save to save it in the database. You can then add the diagram on the map. Adding a diagram on the map is discussed in the next chapter.
Adding a diagram on the map
To add a diagram on the map, open a diagram on a form, or create a new saved diagram, and then click Place on map . Then place the diagram on the map by clicking the left mouse button. You can modify the size of the diagram while you are placing it on the map. To do this, hold down the SHIFT key and move your mouse.
Deleting a diagram
You can delete a diagram and any illustrations of it on the map. First, open the diagram on the form and then click Delete . To delete only the illustration of a diagram, click Delete diagram from map
 and point at the diagram with the left mouse button.
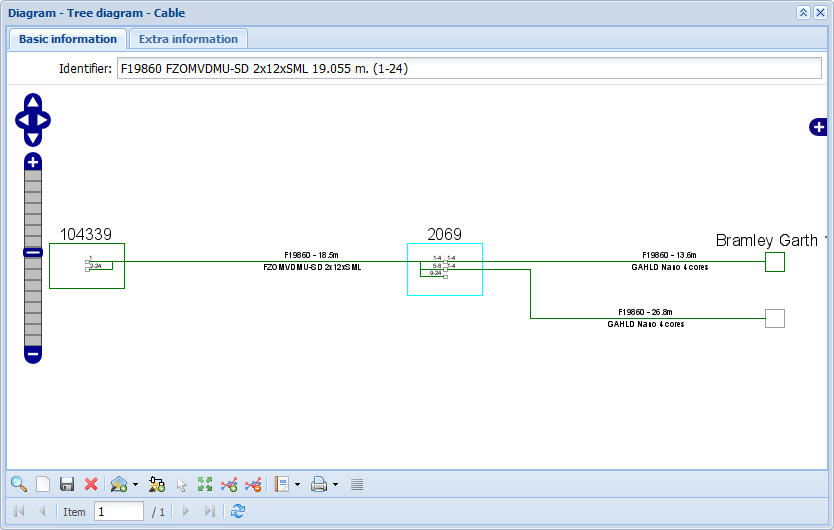
Tree diagram
Activate the Tree diagram function from the device list on the Telecom premises form, Device form, Cable form, Connections management form, or through the Route follower. The Tree diagram function lets you follow the connections of a device or cable either completely or partially for a selected connector/pair range. The connections reserved by the selected circuit section are illustrated in a diagram format.
A tree diagram illustrates the following objects: telecom premises, manholes, splices, and cables. In a tree diagram, the connections of splices and manholes are illustrated as bundles. Internal connections on telecom premises are not illustrated in a tree diagram.
If there are no cross-connections between the devices in the telecom premises that were found using the route follower, no diagram will be drawn between them. You can highlight the diagram objects on the map or open them on a form.
Tree diagram options
The settings for a tree diagram can be defined in the Tree diagram options form. The connector/pair range is determined first in top part of the form. In the Diagram config section you can determine the direction for following the cable and whether following is continued across cross-connections or not. When the Follow checkbox is activated, you can also define whether the direction of logical connections is ascending or descending in the Logical direction drop-down menu. Extra information section includes whether the splice tray and position, or the feeding fibers/pairs are displayed or not. The details of the parent object can be displayed in the Tree diagram by selecting the Parent details option from the Extra information section. When Address field is activated in the Tree diagram options the Tree diagram now shows address data from Telecom premises, Splice and Manhole forms. Splice placement field shows placement information for splices when activated.
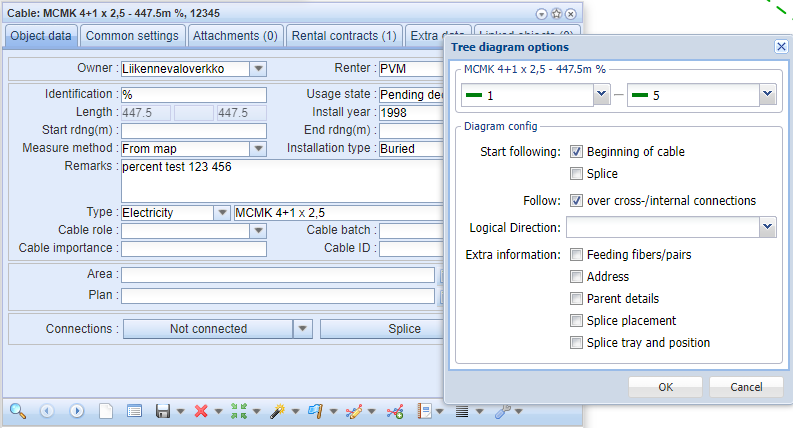
In the figure below, an example of a tree diagram:
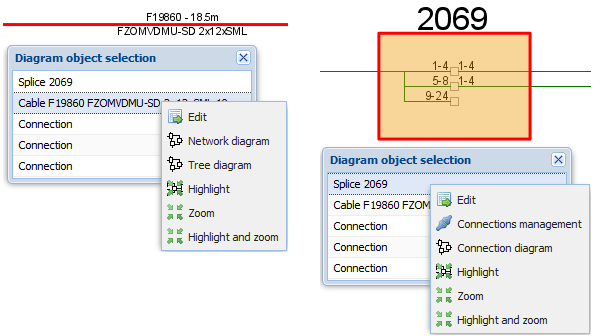
Click Pick diagram objects  to highlight the objects of a tree diagram. In the Diagram object selection list displayed, click an object with the left mouse button to highlight the object in the diagram. To edit an object, or to locate and highlight it on the map, click the right mouse button, and then select the required function.