You can view the results through the network themes in the map view or by viewing the values for single network objects.
Note! If objects separate from the other network are added to modeling, water supply points with negative pressure will be created in the modeling process for calculation purposes. However, these objects will not be imported to KeyAqua.
Theme presentations of results
The bottom section of the form includes functions for the themes of both ducts and nodes:
Duct themes
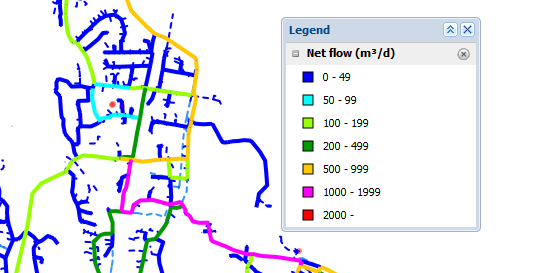
The available options for ducts include, for example, themes for flow direction, net flow and maximum flow. Only one duct theme is displayed at a time. When you change the theme, the program removes the previously selected theme and its legend from the view.
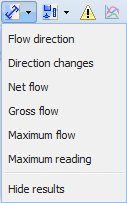
Themes:
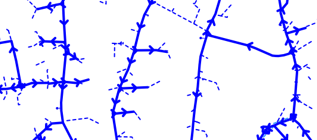
- The Flow direction theme shows the main flow direction with arrows displayed on top of the ducts.
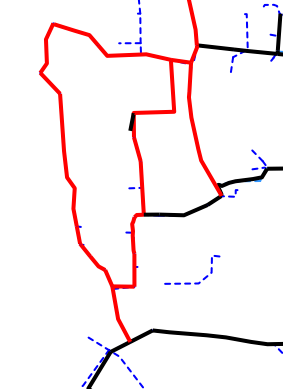
- Use the Direction changes theme to highlight in red the ducts for which the flow direction of water changes once a day or more often.
- Net flow, Gross flow, Maximum flow and Maximum reading. These themes are used to display the ducts in different colours depending on the value of the variable.
- Use the Hide results feature to remove theme colours from the map.
Themes for nodes
For nodes, the available themes are minimum pressure, maximum pressure and delta pressure. Only one node theme is displayed at a time. When you change the theme, the program removes the previously selected theme and its legend from the view. For quality modeling, the available themes also include the age and origin of water.
Use the Hide results feature to remove theme colours from the map window.
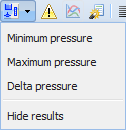
The selected theme is used to visualise the nodes included in the modeling of the network, with colouring representing the pressure values. The theme legend is displayed in the bottom left corner in the map view.
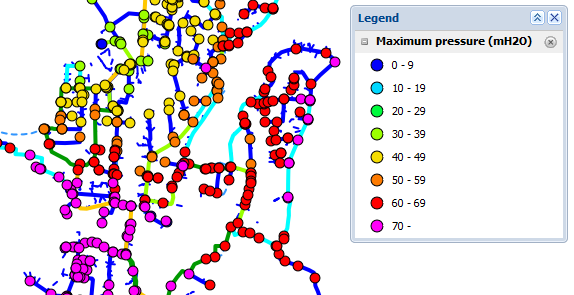
When displaying results for quality modeling, the age of water is displayed by using the applicable theme for the network nodes. The figure in the middle of the symbol is the age of water (hours) for the node in question.
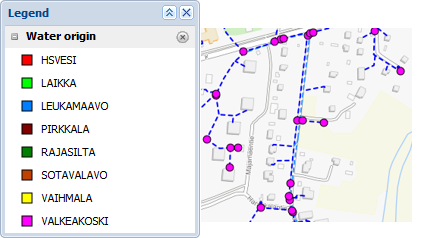
In the Water origin theme, the nodes are visualized according to the water source from which the majority of the water enters the node.
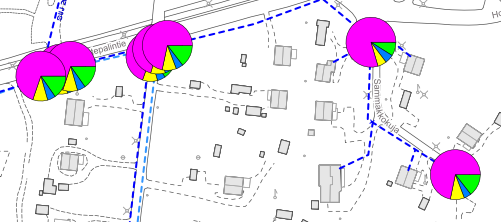
To get a closer look at the sources of water, zoom in on the map. The pie chart displays all the water sources for the node.
Results for individual objects
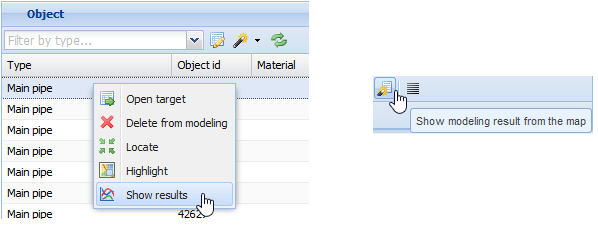
Take the following steps to view the results for individual objects:
- In the object list on the Modeling form, click the right mouse button and select Show results.
- At the bottom of the Modeling form, click Show modeling results from the map
 and then click the network object on the map.
Results for ducts
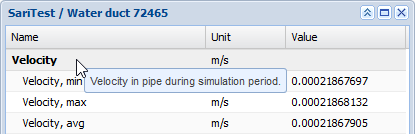
Results for duct modeling are displayed on a separate form:
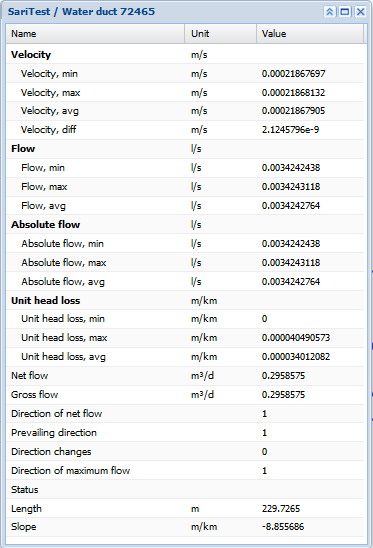
Note! If you remove a duct, the modeling results will show negative pressures.
When you take your mouse cursor over the Name field, the tooltip that is displayed provides more information on the field in question.
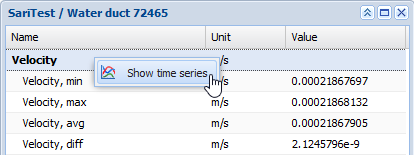
Right-click the Name field to view the menu from which you can select Show time series.
The time series provides graphs for information such as velocity at various times of the day.
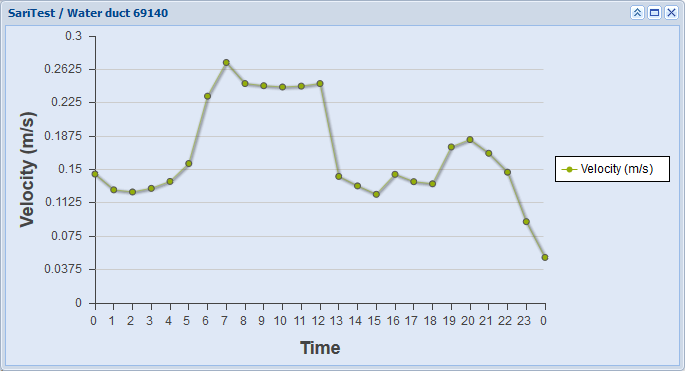
Note! If you have modeled several models for an existing network, the time series will only be available for the latest network model.
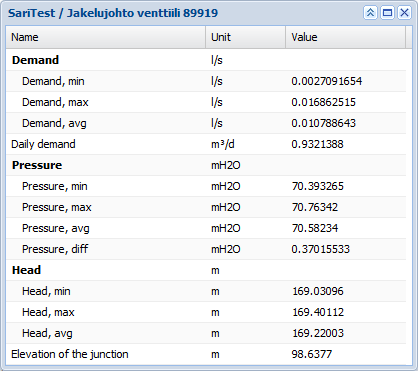
Results for nodes
The modeling results for an individual node are presented on a separate form, on which information such as water usage, pressure category and the pressure level of a node can be viewed. The tooltip and time series functions are the same as described above in the Results for ducts chapter.
Note! If you close a valve or another node in the network, the modeling results will show negative pressures.
Results for nodes in quality modeling
- Retrieve the quality modeling results to the Modeling form by using Search
 .
. - Click Show modeling result from the map
 and select an object from the map in order to view the result for an object.
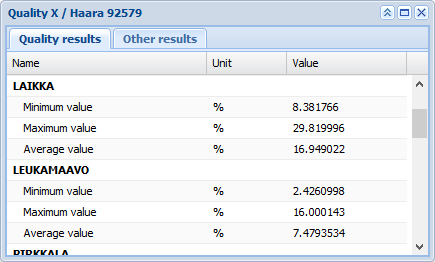
As default, the results form for the quality modeling of a node displays the age and origin of water on the Quality modeling results tab, while other results concerning water usage, pressure class and the pressure level of a node are displayed on the Other results tab.
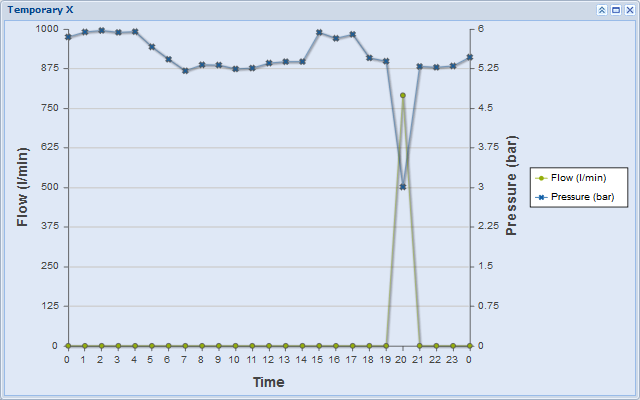
Results for temporary water usage
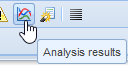
To view the results for temporary water usage click Analysis results at the bottom of the form.
The graph that is displayed shows the changes in pressure and flow. If a specific pressure requirement or take demand is modeled, the modeling software will model the temporary water usage to take place at 8 p.m.