The Water balance calculation  form can be found in the KeyAqua tools. The function can be used to monitor the flow of water and sewerage water through areas. The tool requires all areas to be interconnected by meters in KeyAqua to determine the hourly discharge and inlet volumes of water and wastewater.
The Water balance calculation  form also provides information on daily rainfall from the Finnish Meteorological Institute, which can be viewed on the form and illustrated on the map.
Preparations before using the tool
The implementation of the Water balance calculation tool requires the following preparations:
- Interface: Requires a client management system for water consumption data. Also, AquaRex or an equivalent product is required for pumping station flow data.
- Data analysis and quality improvement project: To ensure that KeyAqua network quality is at the required level.
- Planning: Pumping station areas are created using the Area
 tool. The area cropping is made according to the wastewater sewer network. The consumer points from which wastewater is discharged into the pumping station area are designated inside of this area.
 - Commissioning work: Setting locations for pumping stations both manually and automatically is defined on a customer-by-customer basis.
Water balance calculation form
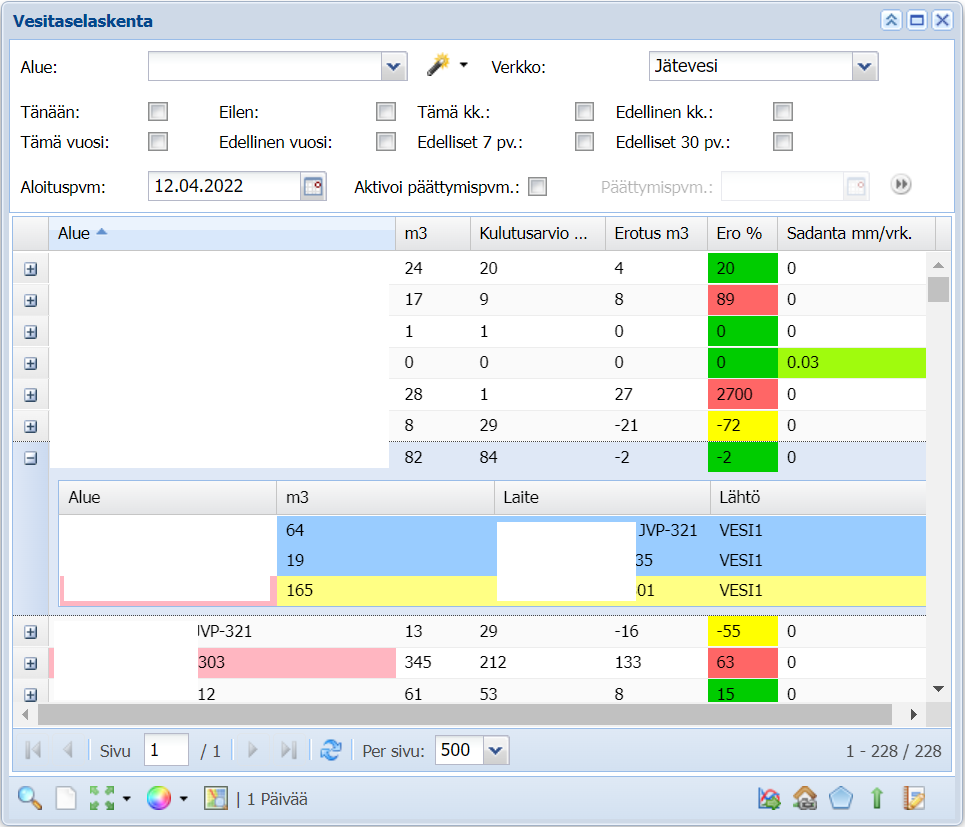
The Water balance calculation  form can be divided into two sections. They are the Search section and the Search results section. The use of buttons common to both forms is discussed in the chapter GENERAL FUNCTIONS OF THE OBJECT FORMS.
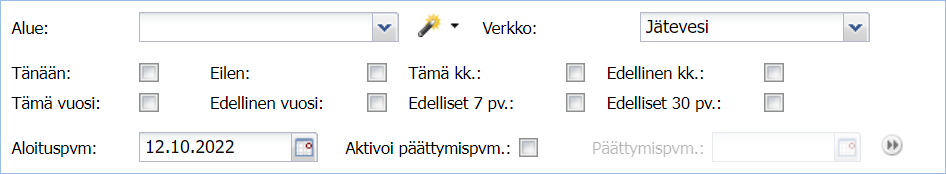
Searching information
The search criteria fields are in the upper part of the form. The system will automatically select the preferred network from the Network drop-down menu.
- Start the search by selecting the area you want from the Area
 menu and the network you want from the Network menu. If you don't select an area, the system retrieves information from all areas.
 - Tiedon haku osion keskiosasata voidaan määrittää aikaväli hakutuloksille valintaruutu-pikanäppäimillä. Klikkaamalla yhtä valintaruutu-laatikkoa, asetat automaattisesti hakutulokselle aloitus- ja päättymispäivät, jotka voi määrittää myös manuaalisesti klikkaamalla Aloituspvm ja Päättymispvm. Mikäli haluat tehdä haun manuaalisesti, aktivoi Päättymispvm-kenttä ensin Aktivoi päättymispvm-valintaruudusta. In the middle part of the search section, you can set a time interval for the search results by clicking the boxes. By clicking one of the checkboxes, you automatically set the start and end dates for the search result, which can also be set manually by clicking Start date and End date. If you want to do the search manually, activate the End date field first from the Activate end date check box.
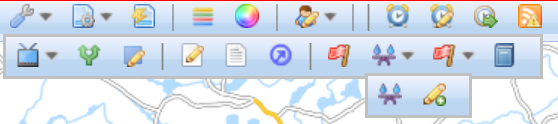
- Finally, press the Update grid
 button on the form's toolbar to perform a search using the criteria you entered. The results appear in the middle part of the Water balance calculation
  form.
form.
The grid and search results
Oletus sarakkeet ja niiden merkitys:
Area: Name of the area
m3: The amount of sewage pumped from the area (sewer), or water consumed in the area (clean water) in cubic meters (m3)
The consumption estimates m3: Estimated amount of consumption/sewage for the selected timespan.
Flow difference m3: The difference between the actual flow and the estimate in cubic meters
Flow difference %: The difference between the actual flow and the estimate in procentage
Precipitation millimeters per day in the timespan: The projected daily rain in millimeters (if the user has precipitation option activated)
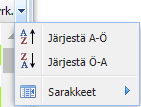
Activate more columns by clicking Columns from the drop-down menu.
The flow data of the Area
To get more detailed information about flows, click on the + symbol on the left of the name of the area. From the drop-down menu, you can view coming and going flows. The areas from which the flow comes are shown in blue fields. The yellow field, on the other hand, shows where water/wastewater has flowed from the selected area.
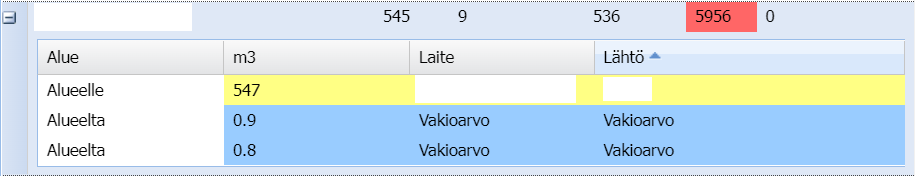
Note! The difference between all the received sewage and the pumped sewage is the amount of sewage produced in the area in that timespan.
The functions of the context menu on the Water balance calculation form
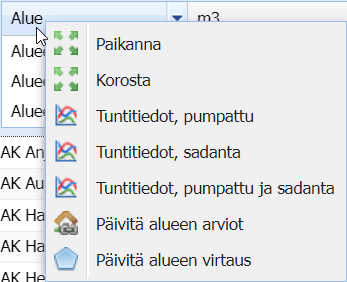
Avaa kontekstivalikon toiminnot klikkaamalla saraketta hiiren oikealla painikkeella:
- Paikanna: Paikantaa ja korostaa valitun alueen verkkokartalla
- Korosta: Ainoastaan korostaa valitun alueen verkkokartalla
- Tuntitiedot, pumpattu: Näyttää tuntitiedot pumpatusta vedestä/viemärivedestä viivakaaviona
- Tuntitiedot, sadanta: Näyttää tuntitiedot kerätystä sadevedestä viivakaaviona
- Tuntitiedot, pumpattu ja sadanta: Näyttää tuntitiedot pumpatusta vedestä/viemärivedestä ja kerätystä sadevedestä viivakaaviona.
- Päivitä alueen arviot: Päivittää alueen kulutusarviot
- Päivitä alueen virtaus: Päivittää arviot alueen virtauksesta
Huom! Voit paikantaa haluamasi alueen nopeasti verkkokartalle kaksoisklikkaamalla sitä taulukosta.
Themes of the Water balance calculation form
You can manage the themes of the searched areas with Themes  tool. The existing themes of the area are automatically activated when the search is performed.
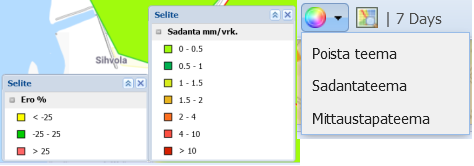
By clicking on the Themes  symbol, the colors appear on the map according to the values of the Flow difference % field. By clicking on the arrow next to the tool, you open a drop-down menu from which you can remove the theme and open the precipitation and measurement method themes on the map.
When activating a theme, the corresponding Legend window will appear on the map. In the Precipitation theme's explanation, the information is obtained from the Precipitation mm/day field of the table, while in the Measurement theme, different measurement methods are illustrated on the map, which are specified in the Device form.
Apply to the chart
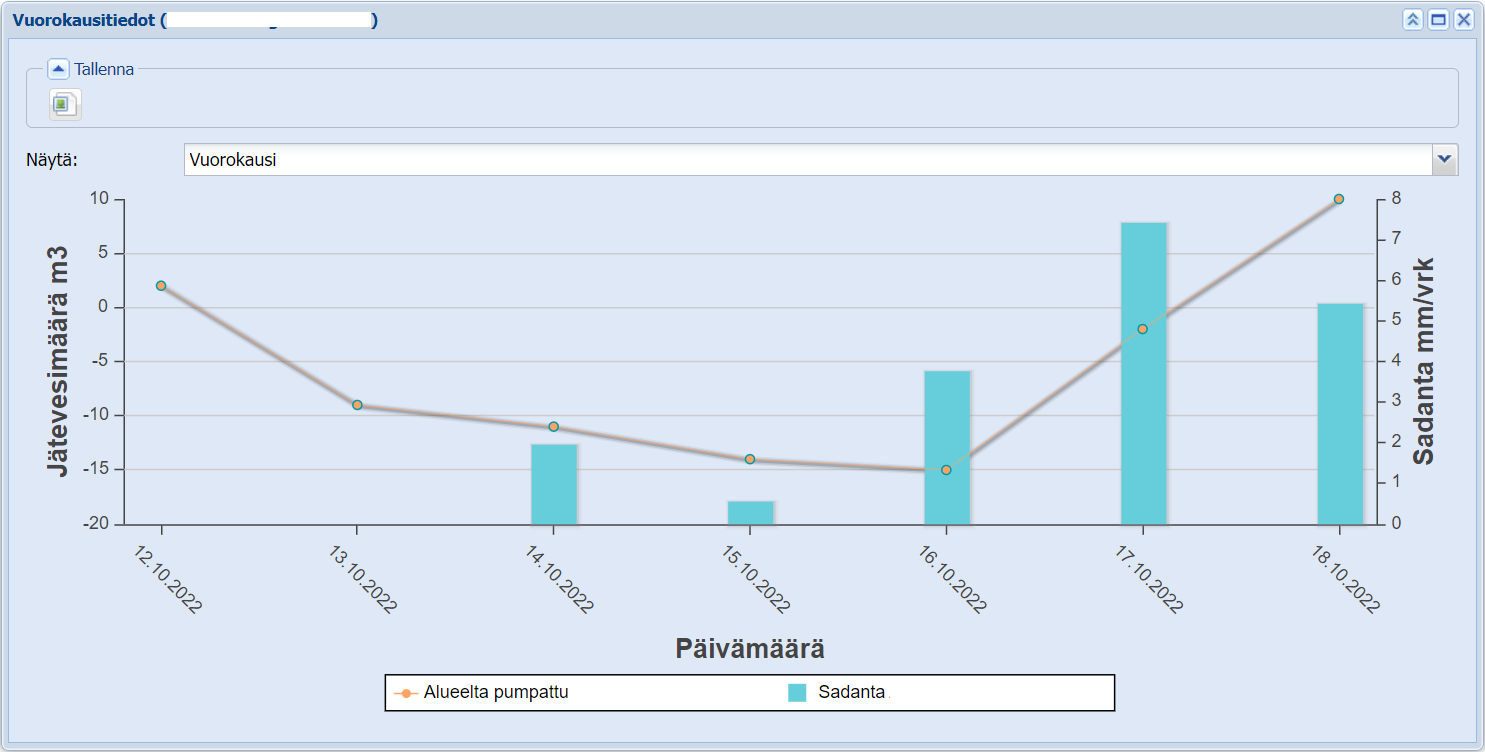
You can open the data of the certain searched time period on a line chart when you only have selected a single area. Click the Search to diagram  button from the toolbar of the Water balance calculation
  form to open the Daily information form. From the Show drop-down menu, you can select the time from which the line graph will illustrate the data. You can also save the chart as an image with the Save button on the top left of the form.
Comparison panel
The user can compare two different search results at the same time with two different water balance calculation forms:
- To open the comparison panel, click the Compare button at the bottom right of the data search section. The form opens a new panel with the same search results next to the original form.
- After this, a new search with new search criteria can be performed on one of the forms. If only one Area row is selected on both forms, you can open both panels to be compared simultaneously as a line chart on the Daily Information form.
