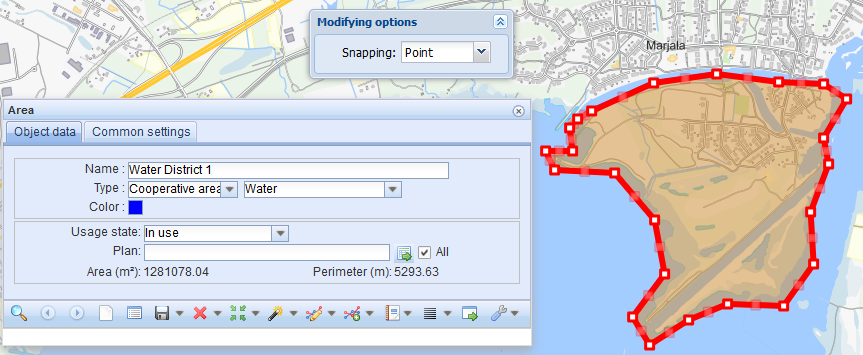
To add an area with the required shape on the map, go to the main toolbar at the top and click Area  . You can add an area on the map, for example, for a print-out. You can define the name, type, colour, and usage state of an area, and you can attach it to a plan. To start the creation of an area, click Create
  . Then move your mouse pointer across the map and click the left mouse button at the appropriate location to create line points. Create the end point by first clicking the left mouse button and then the right mouse button. The area is automatically saved in the database.
Adding a point buffer
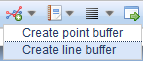
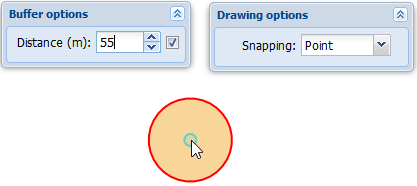
In addition to other shapes, you can create circular-shaped areas. Start the creation by selecting Create point buffer in the drop-down menu for Create. Click the left mouse button on the map to point at the centre of the point buffer. To specify the radius, either click at the required distance from the centre of the area or select the Distance checkbox in the Buffer options dialogue box and define the radius in the field.
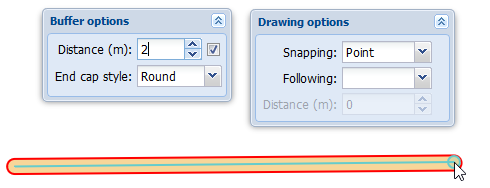
Adding a line buffer
A line buffer creates a predefined area around a drawn line. Start the creation by selecting Create line buffer in the drop-down menu for Create. This opens the Buffer options dialogue box for defining the desired distance and end cap style. If you do not specify the distance by selecting the Distance checkbox, the width of the line buffer is determined when you finish drawing with the mouse. Once you have defined the settings, the buffer will be digitized on the map in the same way as other line objects. When digitizing a line buffer, you can snap to other objects and follow, for example, an existing water duct. The Drawing options are described in further detail in the chapter Snapping and following (settings for drawing and modifying).
Adding a line
You can freely add lines of various thickness and colour on the map, for example, for a print-out. To do this, use the Line  function in the toolbar at the top of the map view to create and update various lines. The functions on the form that opens function in the manner described in GENERAL FUNCTIONS OF THE OBJECT FORMS. For example, search existing lines on the map by clearing the form and clicking Search
  . You can also locate and highlight lines. You can modify the colour or thickness of the lines you searched and picked from the map. Click Save form
  to apply the changes to the map. To have the free-form lines displayed on the map, the object layer in question must be activated in the Layers tool.
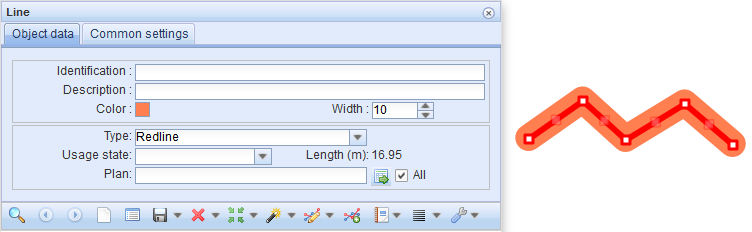
The line in the figure below is in edit mode and its points can be relocated.
If you want to create a new line, select the colour and thickness. To start the creation of a line, click Create  . Then move your mouse pointer across the map and click the left mouse button at the appropriate location to create the starting point of the line. To create the end point, first click the left mouse button and then the right one. The line is automatically saved in the database. When you click the Create button, the Drawing options dialogue box is displayed (Snapping and following (settings for drawing and modifying).
You can reposition the line by clicking Modify  . The line in question is then highlighted on the map. If you click the line using the left mouse button, the line can be modified. You can move the line’s points by dragging them while holding down the left mouse button. Create more points by dragging the dimmed squares that are located between the actual line points. When you move these squares, you create more points. Click Save
  to save the changes. When you click the Modify button, the Modifying options dialogue box opens. The related functions are described in the chapter Snapping and following (settings for drawing and modifying).
Adding text
To add free text to the map, open the appropriate form by clicking Text  on the toolbar at the top of the map view. You can add text on the map, for example, for a print-out.
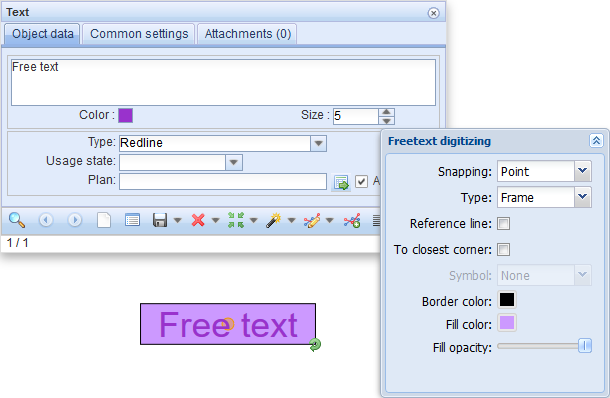
After selecting the colour and text size you want, you can type the text on the form. To define the actual location of the text, click Create  . This opens the Freetext digitizing dialogue box for specifying the text formatting: Type generates either plain text, a frame for the text, or a line under the text. Border color, Fill color , and Fill opacity determine the appearance of the frame.
Other drawing options will affect text having reference lines (Adding text with a reference line on the map ). When you have defined the modifying option settings, place the text on the map by clicking the left mouse button in the desired location. You can change the location by dragging the text placement point. To add text, click Save form  .
.
To search for texts that have been placed on the map, click Search  . You can edit searched texts or text you selected from the map in the text field and then save the changes by clicking Save form. You can delete or locate text retrieved to a form. To change the text location, click Modify. Move the point to the desired location using the left mouse button. Click Save form to save the change.
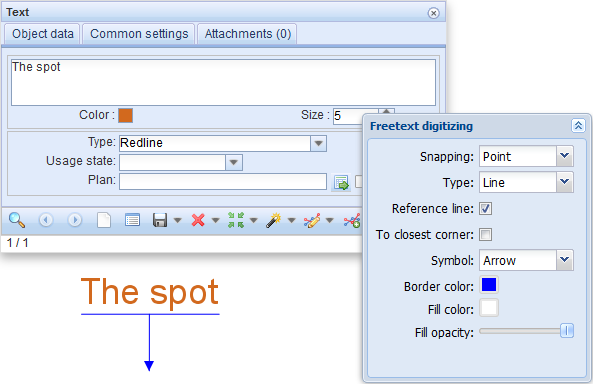
Adding text with a reference line on the map
Adding text with a reference line is started in the same way as standard text. In Drawing options, select either Frame or Line as the text type. In the Symbol menu, you can select an Arrow to be used at the end of the reference line. When placing text, first select the reference line target with the left mouse button and then mark the location of the text. To snap to an object with a reference line, hold down the Shift key (see: Snapping and following).
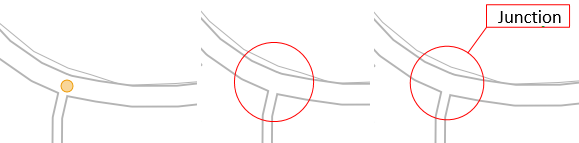
Adding text with a circle reference line on the map
Text with a circle reference is added in the same way as text with a reference line. In the Drawing options, select Circle. When placing a reference, first click on the mid-point of the circle with the left mouse button and then define the radius by clicking on the map. Finally, click on the text location and save the text by clicking Save form  .
.
In the example figure below, 1. Positioning the mid-point of the circle on the map. 2. Defining the size of the circle. 3. Positioning text on the map.